Welcome to the New Jersey Cannabis Market Intelligence platform, prepared for the Cannabis Regulatory Commission by Predictive Pace. This walkthrough is a tour of the dashboard itself, not a market report. It covers thirteen tabs built from market data across three hundred and six active dispensaries, current through September twenty twenty-six. Whether you regulate the market, own a brand competing in it, or operate a dispensary serving it, the platform refreshes every month and the figures on screen are always the latest complete month. The screenshots in this deck are illustrative of the layout; the live dashboard is the source of any number you act on. Let's walk through what each surface shows and how it serves your role.
Before you start
How to navigate this walkthrough
1 Navigate the deck
← / → arrow keys or Space to advance
☰ icon (top-left) or press T to jump to any section
Back / Next buttons at bottom-center
2 Voice narrator (top-right)
OFF (default): silent until you click Play
ON: narration plays automatically per slide
Run Deck: full autoplay with auto-advance
3 Click any screenshot to zoom
Cursor changes to a magnifier on hover
ESC or click the backdrop closes the zoom
Screenshots labeled A, B, C are sections of the same page
Screenshots show layout, not live figures — open the dashboard for any number you act on
4 "Read all" mode (top-right)
Flattens entire deck into one scrollable document
Best for solo review or sharing with colleagues
5 Persona callouts on every page
CRCBrandDispensary boxes show role-specific insights
🎤 Narrator
Quick orientation. Navigate with arrow keys or the buttons at the bottom. The menu icon in the top left jumps to any section. Voice toggle at top right auto-plays narration per slide, or hit Run Deck for full autoplay. Click any screenshot to zoom in. Escape closes it. Every page in this walkthrough includes persona-specific callouts for CRC regulators, brand owners, and dispensary operators, so you can focus on the insights relevant to your role.
The platform
13 tabs, one market, role-aware filtering
Your 4-tab CRC view
Your 5-tab Brand Owner view
Your 5-tab Dispensary Operator view
The full platform includes 13 tabs — and the dashboard marks the ones built for your role, so you know where to start. Every tab stays available.
When you select CRC / Regulator on the dashboard, these 4 tabs are marked as your recommended view. These are your monthly read for market health, equity, and concentration policy.
When you select Brand Owner on the dashboard, these 5 tabs are marked as your recommended view. These are the screens that drive every brand-growth decision you make.
When you select Dispensary Operator on the dashboard, these 5 tabs are marked as your recommended view. These are the screens that turn ad-hoc inventory and pricing decisions into data-driven plays.
Per-brand door map, gap dispensaries, competitor brands
In deck
Role-aware tab filtering
The dashboard's "View As" selector at top-right filters the tab nav itself — CRC regulators see 4 tabs (Executive Summary, Market Concentration, Social Equity, NJ Map). Brand owners see 5 (Exec, Category Deep-Dive, Price, Brand Report, Brand Intel). Dispensary operators see 5 (Exec, Market Overview, Scorecard, NJ Map, Competitive Intel). Same data, three different lenses — no manual sorting needed.
The CRC workflow this enables
Open the dashboard, select CRC / Regulator, and the four tabs above are your full surface area. Executive Summary for the period snapshot. Market Concentration for HHI policy evidence. Social Equity for the verified ownership designations. NJ Map for geographic equity. Quarterly read in 15 minutes, no manual data pulls.
The Brand Owner workflow this enables
Select Brand Owner on the dashboard and these five tabs are your home screen. Executive Summary for context. Category Deep-Dive to spot category trajectory. Price Accessibility to position your pricing. Brand Competitive Report for your velocity per door, PPI, and market share. Brand Intel for the door-by-door distribution gaps. Every brand-growth decision happens on these five pages.
The Dispensary Operator workflow this enables
Select Dispensary Operator and these five tabs are your daily read. Executive Summary for context. Market Overview for regulatory risk and revenue trends. Dispensary Scorecard for your location benchmarked against the entire state. NJ Map for trade-area analysis. Competitive Intel — the highest-ROI section — for brand gaps, whitespace, and rising brands within 10 miles.
🎤 Narrator
The platform now has thirteen tabs in total. We're walking the highest-impact surfaces today. One critical change since the last walkthrough — the dashboard now filters its tab navigation by role. CRC regulators see four tabs. Brand owners and dispensary operators each see five. That cuts cognitive load substantially. Same underlying data, three different lenses. Same single dashboard, no manual sorting needed. Select your role from the persona buttons above to see the four or five tabs that filter to your view.
When you select CRC / Regulator on the dashboard, the tab navigation filters to four core screens. Executive Summary for the period snapshot, with headline figures and the category landscape. Market Concentration for HHI by category — your anti-concentration evidence base with three-tier classifications. Social Equity for the unified MSO and Independent ranked table plus the verified social-equity and diversely-owned dispensaries, each cited to a CRC board memo or the NJSAVI registry. And NJ Map for geographic equity audit across all twenty-one counties. Four screens, read monthly, with every figure traceable to its source.
When you select Brand Owner on the dashboard, the tab navigation filters to five core screens. Executive Summary for market context and growth signals. Category Deep-Dive to identify where to play, who's already winning, and which categories are expanding. Price Accessibility to position your pricing against category averages and find your margin room. Brand Competitive Report — the home tab — for your velocity per door, PPI, and market share rankings. And Brand Intel for the door map and distribution gaps. Five screens, every brand-growth decision you make for the quarter.
When you select Dispensary Operator on the dashboard, the tab navigation filters to five core screens. Executive Summary for market context. Market Overview for revenue trends and the regulatory risk monitor. Dispensary Scorecard for your location benchmarked against the entire state, with the Mix Score and automated portfolio recommendation. NJ Map for trade-area analysis with revenue-tier pin coloring. And Competitive Intelligence — the single highest-ROI section of the entire platform — for brand gaps, whitespace, and rising brands within your ten-mile radius. Five screens that turn ad-hoc decisions into data-driven plays.
Who this is for
Three personas, three decision frameworks
Every surface in this platform is built to serve three distinct roles. Here's what each persona cares about, the decisions they make, and how the dashboard pays for itself.
⚖
CRC / Regulator
Cannabis Regulatory Commission · Office of Diversity & Inclusion
What they need
Market health monitoring across all 306 active dispensaries
MSO vs Independent equity metrics for legislative testimony
Entry barrier detection by category
Data-backed policy recommendations
Key decisions
License allocation by category. Concentration thresholds. Social equity program design. Quarterly market reports for the legislature.
ROI: A monthly market view between the Commission's quarterly data reports
★
Brand Owner
Cannabis brand operators · Sales & distribution teams
What they need
Market sizing and category growth trajectories
Distribution gap analysis (which doors don't carry you)
Pricing intelligence vs competitor averages
Rising brand detection and whitespace opportunities
Key decisions
Which dispensaries to target next. Pricing strategy by category. Category entry/exit timing. Competitive response to rising brands.
ROI: Distribution gaps and pricing, door by door, refreshed monthly
⛳
Dispensary Operator
Location managers · Purchasing & merchandising
What they need
Their location benchmarked against 280 others
Category mix vs statewide market average
Automated portfolio rebalancing recommendations
Competitor assortment within 10-mile radius
Key decisions
Shelf allocation by category. Which brands to add or drop. Pricing vs neighbors. Whitespace brands for first-mover advantage.
ROI: Your store benchmarked against its neighbors and the state
Same data, different lens
Every tab in the platform serves all three personas. The persona callout boxes on each slide in this deck highlight what's specifically relevant to your role. Look for the colored borders: green = CRC, gold = Brand, cyan = Dispensary.
🎤 Narrator
Before we get into the dashboard itself, let's be clear about who this is for. Three personas. CRC regulators need market health monitoring, equity metrics, and data-backed policy recommendations for the legislature. Brand owners need market sizing, distribution gaps, pricing intelligence, and rising brand detection. Dispensary operators need their location benchmarked against the entire state, with automated recommendations for what to add, drop, or reprice. The same underlying data serves all three, but the decisions are different. Throughout this walkthrough, look for the colored persona boxes on each slide. Green for CRC, gold for brand owners, cyan for dispensary operators. Each one highlights what's specifically relevant to your role and quantifies the ROI.
The data
What powers the platform
Source
Market data from LitAlerts, a commercial aggregator that collects product and inventory data from dispensary websites across New Jersey. Sales and units are the provider's estimates, built from observed inventory movement — not seed-to-sale records.
Coverage
306 active dispensaries across New Jersey (September 2026)
9 product categories, each tracked separately by brand
2.23M units in September 2026 · 18.0M Jan–Sep
$60.1M tracked retail in September 2026 · $514.6M Jan–Sep
Price data is partial — not every store lists prices consistently
Revenue and units are estimates; the Commission's own sales records are the official figures
Data integrity
Every monthly refresh runs through a 30-check validation pipeline: date coverage, row reconciliation, deduplication, month-over-month change reasonability, and category standardization. Outlier rows are flagged and excluded from dashboard metrics.
🎤 Narrator
A quick word on the data. Everything in this platform is powered by market data from LitAlerts, a commercial aggregator that collects product and inventory data from dispensary websites across New Jersey. For September twenty twenty-six, that's three hundred and six active dispensaries and two point two three million units, with eighteen million units across January through September. The data refreshes monthly through an automated pipeline with thirty validation checks, including deduplication, date coverage verification, and outlier detection. We're open about the limits. Sales and unit figures are the provider's estimates, built from observed inventory movement, not seed-to-sale records, and the Commission's own sales data remains the official count. Two categories, Beverages and Oral, currently carry a source-feed anomaly and are held out of growth and concentration claims while we confirm it with the provider. What it adds is detail the official totals don't carry: brand, product, price and store, every month.
The workflow
How you'll use the dashboard — by role
Before we walk the pages, here's the path through the dashboard for each persona. Use this as a map for what comes next.
CRC / Regulator workflow
Step 1: Open Executive Summary for market health snapshot
Step 2: Check Social Equity for unified MSO + Independent ranked table + verified social-equity dispensaries
Step 3: Review Policy Recommendations, each linked to underlying data
Step 4: Use Market Concentration tab for HHI deep-dive by category
Step 5: Export findings to PDF for committee presentations
TIME SAVED: ~40 hours/quarter vs manual data compilation
Brand Owner workflow
Step 1: Check Brand Report for your PPI score and MoM growth
Step 2: Open Brand Intel for your door map and gap dispensaries
Step 3: Use Competitive Intel to find dispensaries where competitors carry brands you don't
Step 4: Check Price Accessibility for category pricing trends
Step 5: Build expansion priority list from whitespace + brand gaps
TIME SAVED: ~20 hours/month vs manual competitor research
Dispensary Operator workflow
Step 1: Open Dispensary Scorecard, select your location
Step 2: Review category mix vs market average
Step 3: Read automated Portfolio Recommendation
Step 4: Click "View Competitive Analysis" for your CI deep-dive
Step 5: Act on Brand Gaps and Whitespace to fill assortment holes
TIME SAVED: ~15 hours/month vs manual competitor visits
Three controls that shape your view
The dashboard header includes a "View As" selector that marks the tabs built for your role (CRC 4, Brand 5, Dispensary 5) while leaving all 13 available. The period selector is built from the data itself — every loaded month, each consecutive month-over-month pair, and each quarter — so a new month appears on its own each cycle and the latest complete month is always the default. A built-in PDF export button packages whatever you're viewing for committee or stakeholder distribution.
🎤 Narrator
Before we walk the pages, here's the path through the dashboard for each persona. Use this as a map for what's coming next. If you're a CRC regulator, your path is Executive Summary first for the market health snapshot, then Social Equity for the MSO versus Independent metrics and the auto-generated policy recommendations. That workflow replaces roughly 40 hours per quarter of manual data compilation. If you're a brand owner, start with your Brand Report for PPI and growth, then Brand Intel for your distribution map and Competitive Intel for whitespace opportunities. Roughly 20 hours per month of competitor research, automated. If you're a dispensary operator, start with the Dispensary Scorecard for your location, review the category mix versus market average, read the portfolio recommendation, then click through to Competitive Intel for brand gaps and whitespace. About 15 hours per month replaced by one tab. Three controls shape your view — the View As selector filters the tab nav itself, the period selector covers all 12 available periods, and a PDF export packages anything you're viewing for committee distribution. Now let's walk the pages.
Tab 1 · Executive Summary
The NJ cannabis market on one screen
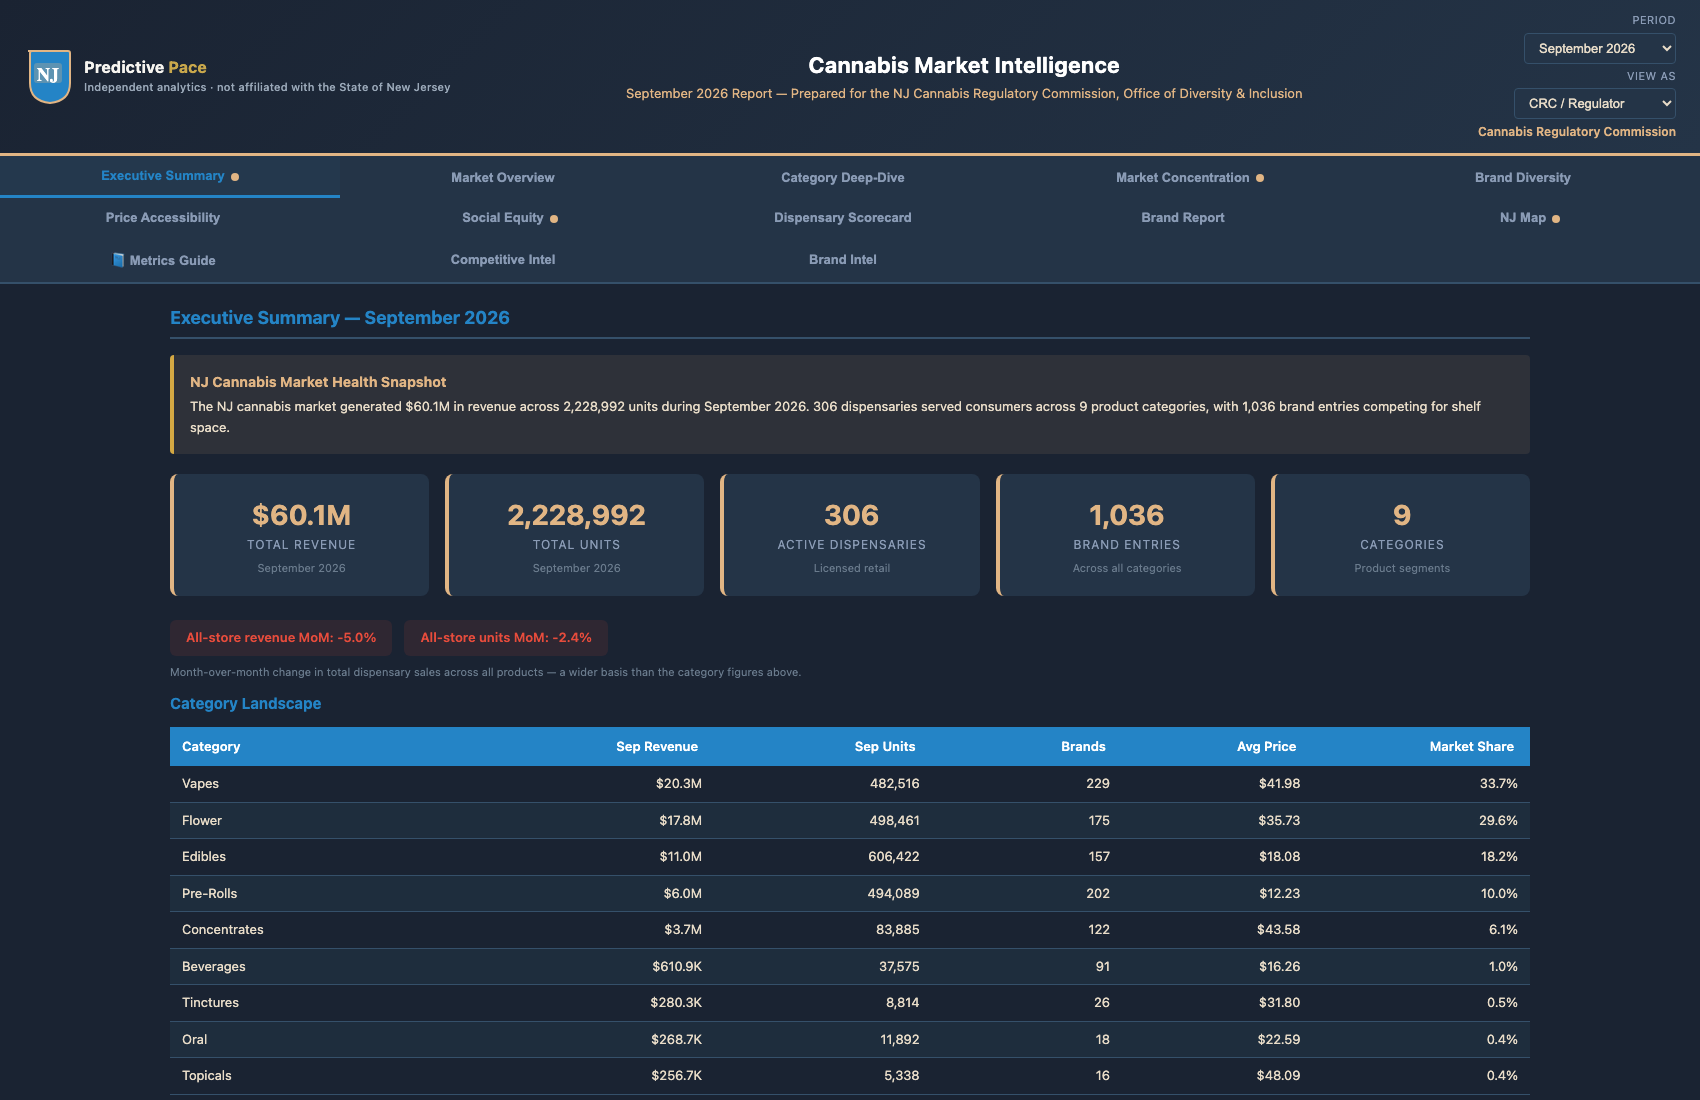
Executive Summary (top) — market snapshot and category landscape (layout shown; live figures on the dashboard)
$0M
Revenue (Sep 2026)
0M
Units (Sep 2026)
0
Active Dispensaries
0
Product Categories
CRC / Regulator
One-screen market health check: is revenue growing? How many categories are active? Are dispensaries keeping pace with demand?
ROI: A monthly view between the Commission's quarterly data reports
Brand Owner
See total addressable market by category. In September 2026 Vapes led at $20.3M (33.7%), followed by Flower at $17.8M (29.6%) and Edibles at $11.0M (18.2%). Spot where your brand sits in the revenue stack.
ROI: Market sizing in seconds, not weeks of research
Dispensary Operator
Benchmark your category mix against the statewide average. If Edibles is 18.2% of the market but 2% of your shelf, that's a gap.
ROI: Category gaps = missed revenue from existing foot traffic
🎤 Narrator
The Executive Summary puts the entire New Jersey cannabis market on one screen. For September twenty twenty-six, that's sixty point one million dollars in tracked retail on two point two three million units, across three hundred and six active dispensaries and nine product categories. For a regulator, it is a monthly market health snapshot that sits between the Commission's own quarterly data reports. For a brand owner, it's instant market sizing — Vapes led at twenty point three million dollars, Flower at seventeen point eight million, Edibles at eleven million. For a dispensary operator, the category landscape table is the benchmark. If the market allocates thirty-four percent to Vapes and you're at twenty, you're leaving revenue on the table from existing foot traffic.
Tab 1 · Executive Summary (continued)
Market concentration, MSO vs Independent, and growth leaders
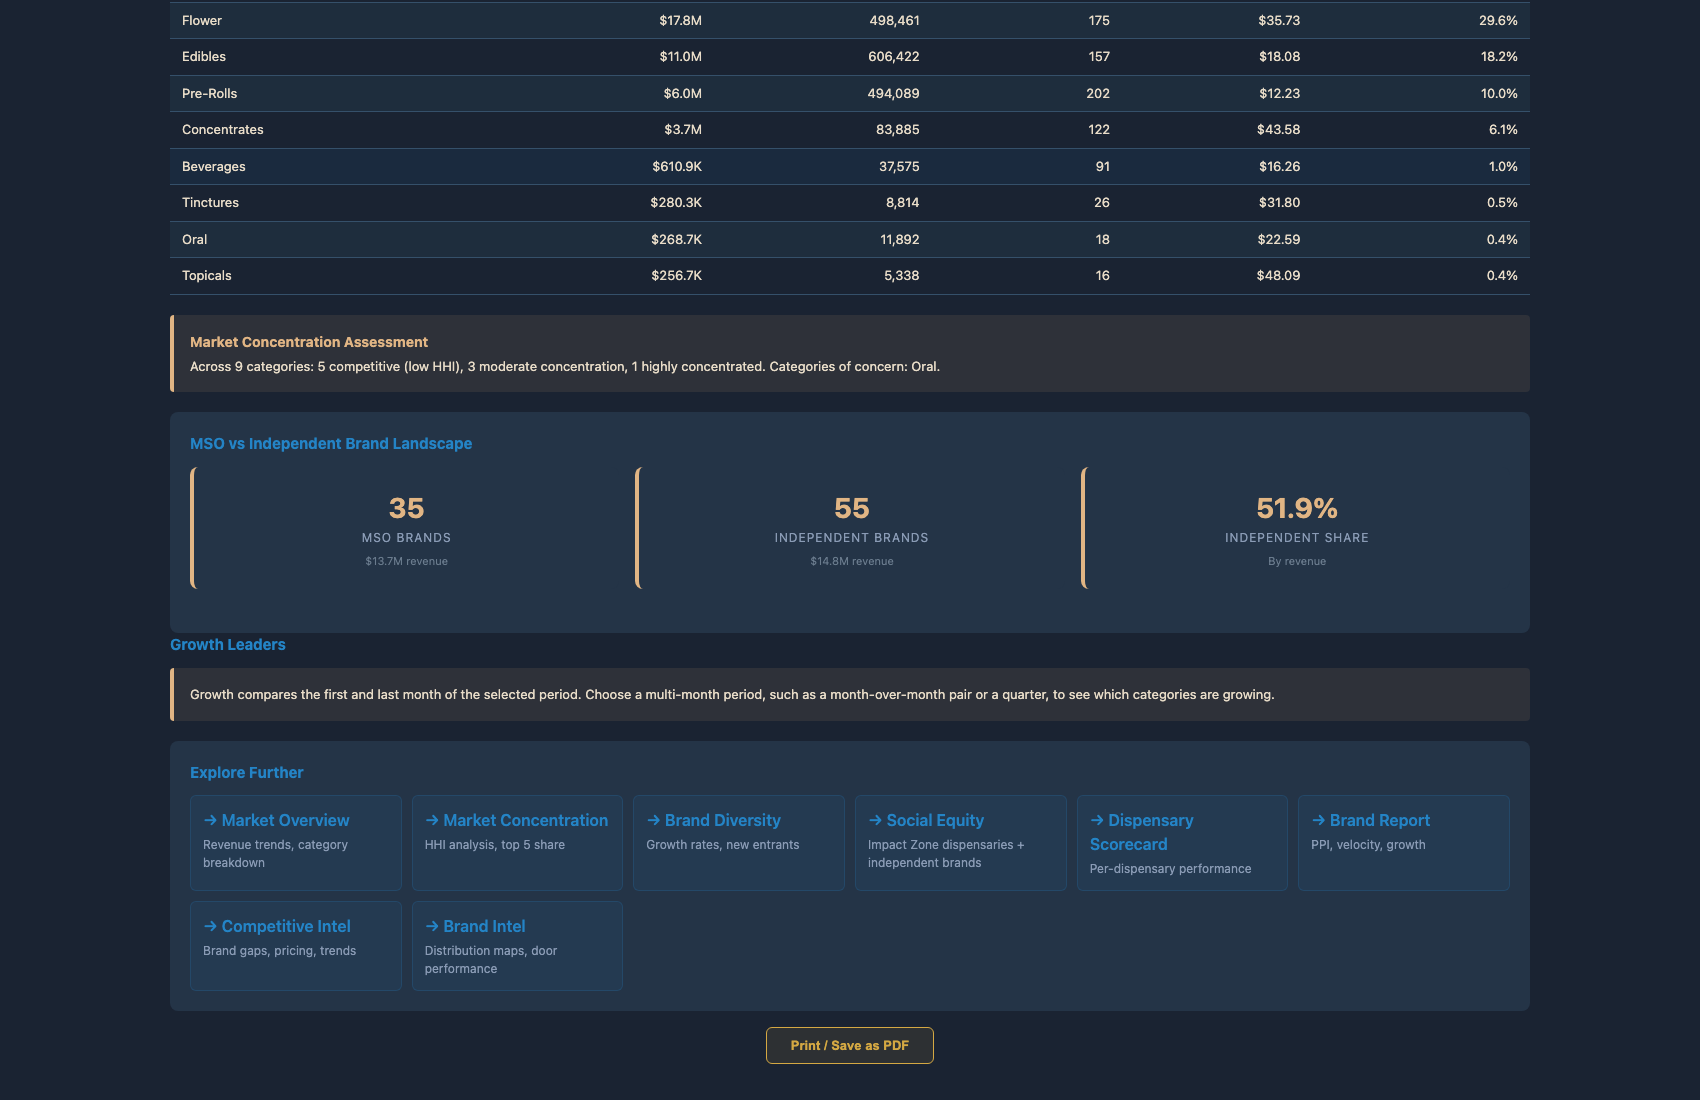
Executive Summary (bottom) — MSO vs Independent landscape, growth leaders by category
What this panel shows
The lower half of the Executive Summary splits the market two ways. MSO vs Independent gives brand count and revenue for each side, so you can see whether independents are holding share. Growth leaders ranks categories by unit and revenue movement over the selected period. Both recompute for whichever period the header is set to — read them live rather than from this deck.
One caution on the growth table
Two categories, Beverages and Oral, currently carry a source-feed anomaly that has persisted across consecutive months. The data cannot yet distinguish an upstream reclassification from genuine category formation, and a query is open with the data provider. Together they are 1.5% of September revenue, so nothing material rests on them — but treat their growth figures as unconfirmed.
CRC / Regulator
The MSO/Independent split is a direct market-structure metric, and it is the one to trend rather than to read once. Note the limit: the MSO label is matched on brand name, so it identifies affiliation, not corporate ownership.
ROI: Data-backed equity reports for legislative hearings
Brand Owner
The growth-leaders table is your category entry signal: rising units with a low HHI is the open window. Check the figures live — and skip Beverages and Oral until the feed question is settled.
ROI: Category entry/exit decisions grounded in market trajectory
Dispensary Operator
The growth-leaders table directly informs shelf allocation: lean into categories gaining units, reduce SKU depth where they are falling. Read it for the period you actually buy against.
ROI: Shelf allocation matched to actual demand curves
🎤 Narrator
Scrolling down the Executive Summary reveals the competitive structure. The left panel splits the market into multi-state-operator brands and independents, giving brand count and revenue for each, so the Commission can trend whether independents are holding share. One limit worth stating: that label is matched on brand name, so it identifies affiliation rather than corporate ownership. The Growth Leaders table on the right ranks categories by unit and revenue movement across whatever period you have selected. One caution before you read it. Two categories, Beverages and Oral, are carrying a source-feed anomaly that has persisted across consecutive months. We cannot yet tell an upstream reclassification apart from genuine category formation, and we have a query open with the data provider. Together they are one point five percent of September revenue, so nothing material rests on them, but treat their growth figures as unconfirmed until that is resolved.
Tab 2 · Market Overview
Regulatory Risk Monitor — what's coming, and what it means
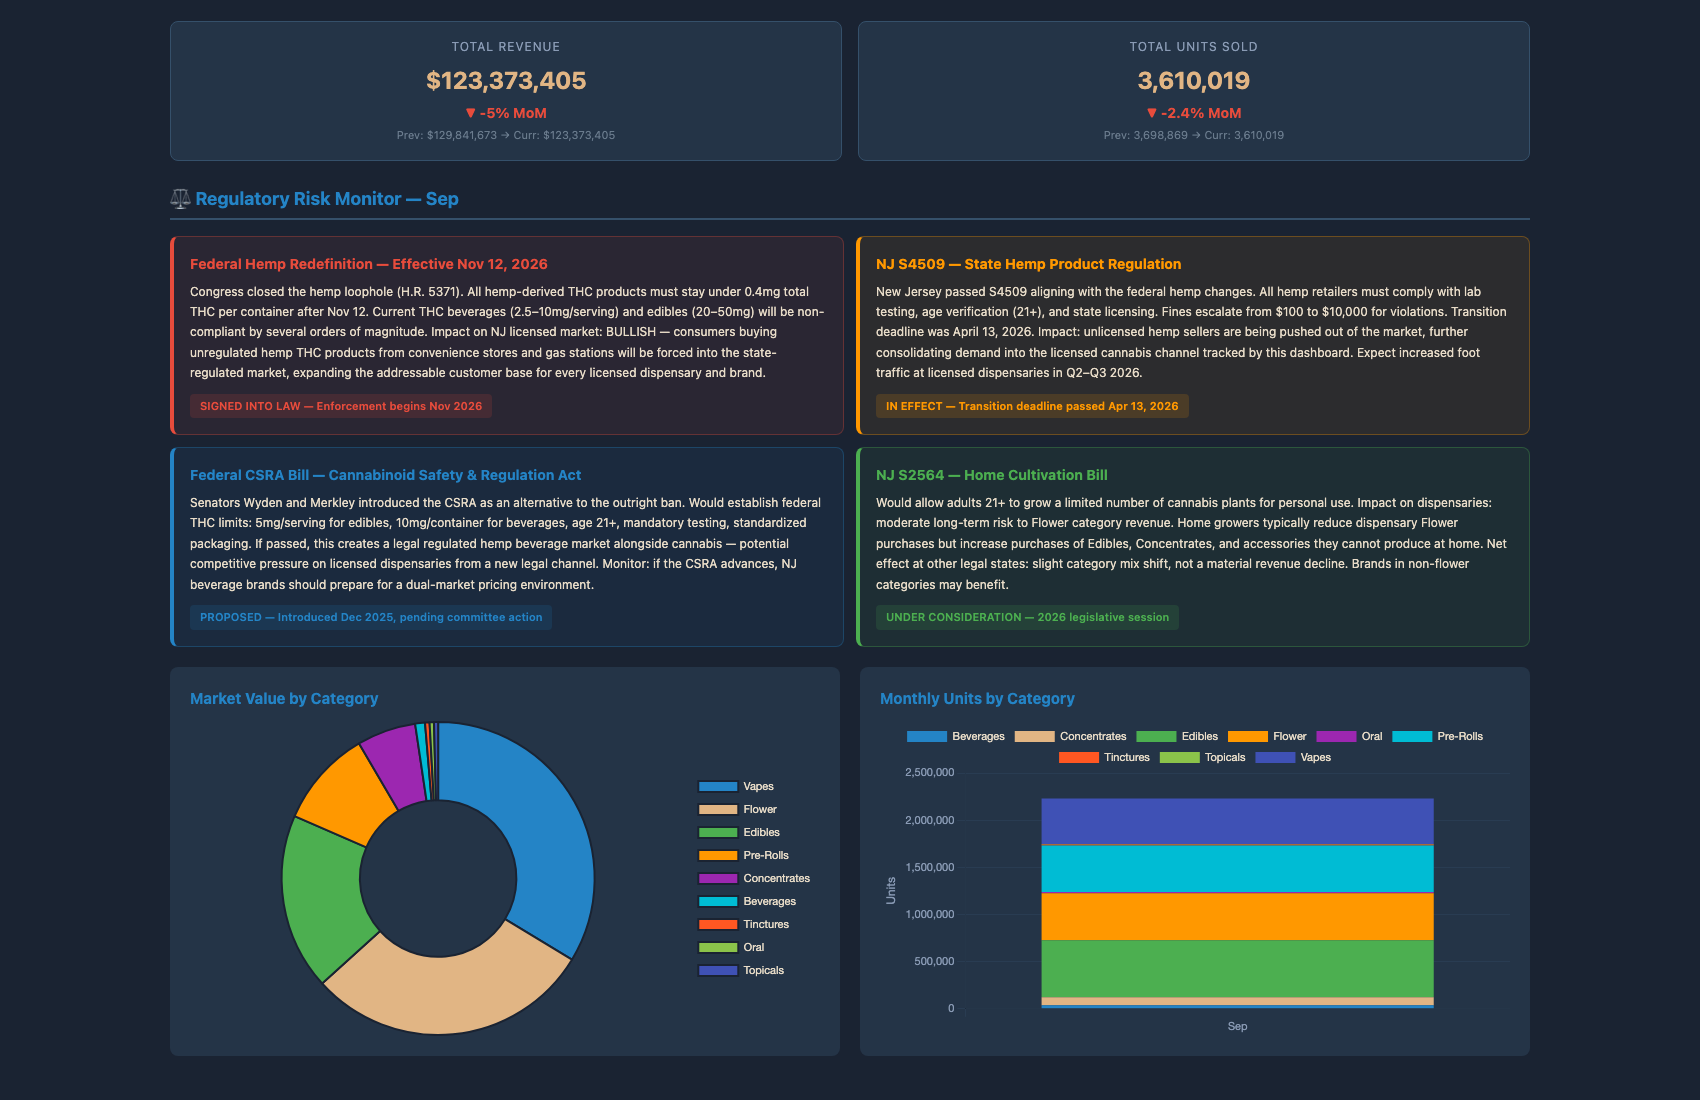
Regulatory Risk Monitor — federal hemp redefinition, NJ S4509, CSRA, and home cultivation cards
The four risks every NJ cannabis stakeholder must track
Each card surfaces the regulation, its enforcement date, and a plain-English impact read for the licensed NJ market — not a press release summary, an operator-relevant interpretation. Federal Hemp Redefinition (HR 5371, effective Nov 12 2026), NJ S4509 (state hemp product regulation), Federal CSRA (cannabis safety bill), and NJ S2384 (home cultivation).
CRC / Regulator
One screen tracks every regulatory action moving through state and federal channels with NJ market impact. The interpretation column converts legislative language into operational consequences for licensed operators.
The federal hemp redefinition is the big one — current hemp THC beverages and edibles will be non-compliant after Nov 12. For licensed cannabis brands, that's bullish: hemp consumers will be forced into the regulated market.
ROI: Strategic timing on inventory, pricing, and category bets ahead of the shift
Dispensary Operator
Expect a wave of new consumers post-Nov 12 as hemp THC products in convenience stores and gas stations become non-compliant. Plan inventory depth, training, and category mix for the addressable expansion.
ROI: Capture upside from federal-driven customer migration
🎤 Narrator
One of the highest-impact additions since the last walkthrough — the Regulatory Risk Monitor on the Market Overview tab. Four cards. Federal Hemp Redefinition, signed into law as HR 5371 and effective November 12, 2026. After that date, hemp-derived THC products must stay under 0.4 milligrams of total THC per container. Current hemp THC beverages and edibles in convenience stores and gas stations will be non-compliant by orders of magnitude. The plain-English impact line says the quiet part out loud — bullish for the licensed New Jersey market. Consumers buying unregulated hemp THC products will be forced into the state-regulated channel, expanding the addressable customer base for every licensed dispensary and brand. Card two — NJ S4509, the state's parallel hemp regulation. Card three — the federal Cannabis Safety and Regulation Act. Card four — NJ S2384, the home cultivation bill. For the CRC, this is one screen instead of a stack of legislative digests. For brand owners and dispensary operators, it's strategic positioning data for the inventory, pricing, and category bets you're making this quarter.
Tab 4 · Market Concentration
HHI by category — the CRC's anti-concentration evidence base
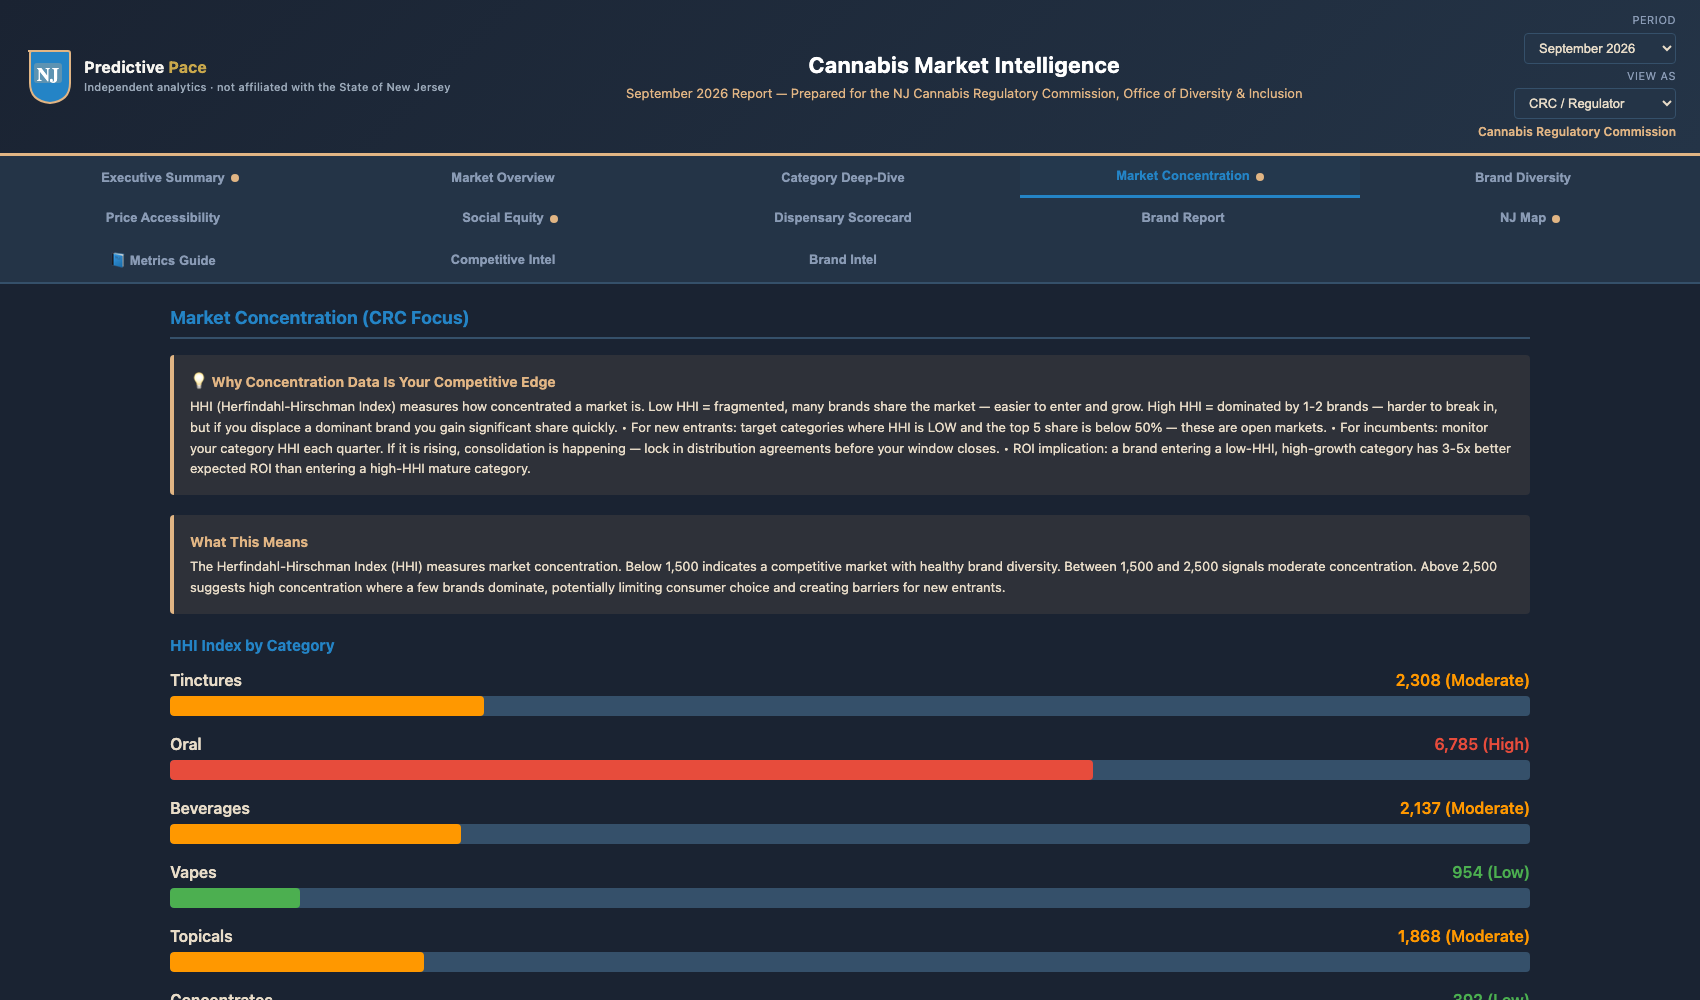
Market Concentration (CRC Focus) — HHI Index by Category with competitive/moderate/concentrated classifications
What HHI tells you
The Herfindahl-Hirschman Index measures how concentrated a category is — the sum of every brand's squared share. The dashboard prints the band beside the number so you never have to interpret it: Low (below 1,500) = fragmented, healthy competition. Moderate (1,500–2,500). High (above 2,500) = one or two brands dominate. These are the 2010 U.S. Horizontal Merger Guidelines bands, the same ones the market brief cites, applied in the database that labels each category. It shows which categories may warrant a closer look.
CRC / Regulator
Monitor HHI per category each quarter. If concentration is rising in any segment, evaluate licensing incentives or targeted relief for independent operators before consolidation locks in incumbents.
ROI: Anti-concentration policy evidence with audit-ready citations
Brand Owner
Low-HHI categories with growing demand = best entry conditions. High-HHI categories with stable demand = harder to break in but bigger share to capture if you displace a dominant brand.
ROI: Category entry timing grounded in real market structure
Dispensary Operator
Categories with low HHI = more brand choice for assortment depth. High-HHI categories = lock-in distribution agreements early, since dominant brands often constrain supply.
ROI: Smarter supplier diversification by category
🎤 Narrator
The Market Concentration tab is the CRC's anti-concentration evidence base. Every category gets an HHI score — Herfindahl-Hirschman Index — with its band printed alongside it. Low, below fifteen hundred, means the category is fragmented and competitive. Moderate runs from fifteen hundred to twenty-five hundred. High, above twenty-five hundred, is where one or two brands dominate. Those are the 2010 federal merger guideline bands, the same ones the market brief cites. The accompanying donut charts show Top 5 brand share by category, and stacked bars show MSO versus Independent brand share. For the CRC, this is one screen of policy-grade evidence. For brand owners, it's category entry intelligence — low-HHI categories with growing demand are your best entry conditions. For dispensary operators, it shapes supplier diversification. A low-HHI category means more brand choice for assortment depth. A high-HHI category means you should lock in distribution agreements before consolidation closes the window.
Tab 7 · Social Equity
Verified social equity, measured at the source
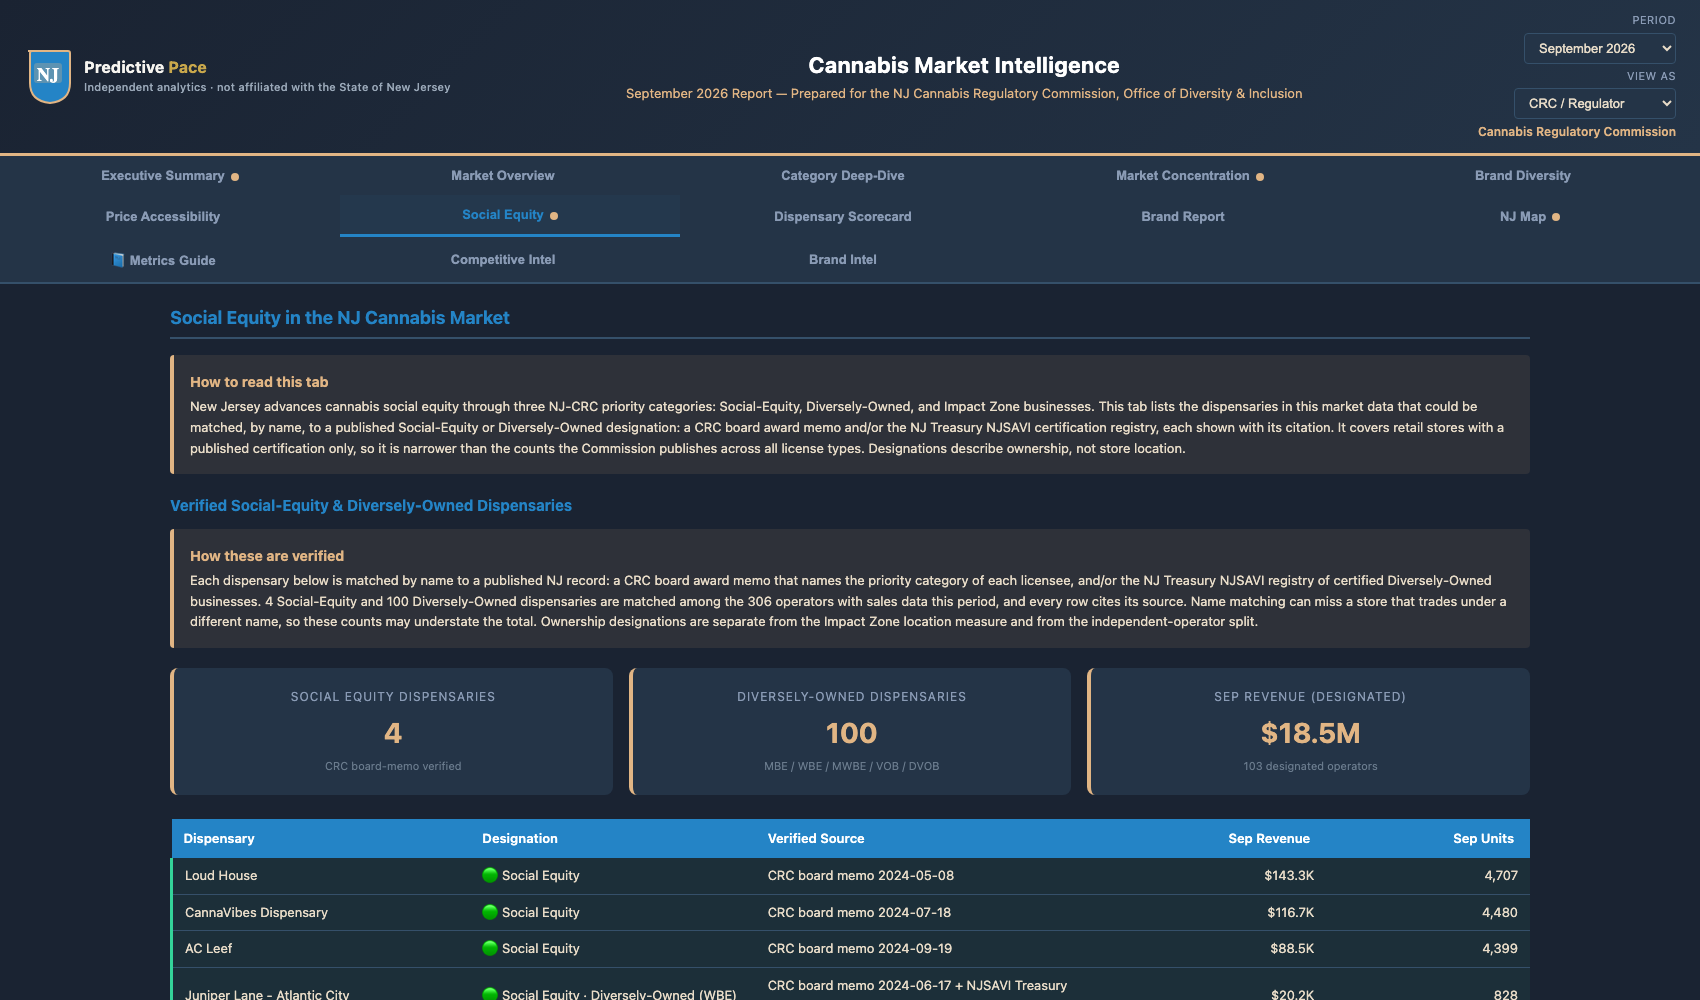
The Social Equity tab looks at a question the Office of Diversity & Inclusion already tracks through its license benchmarks: are equity-designated operators sharing in the market's revenue, not just its licenses?
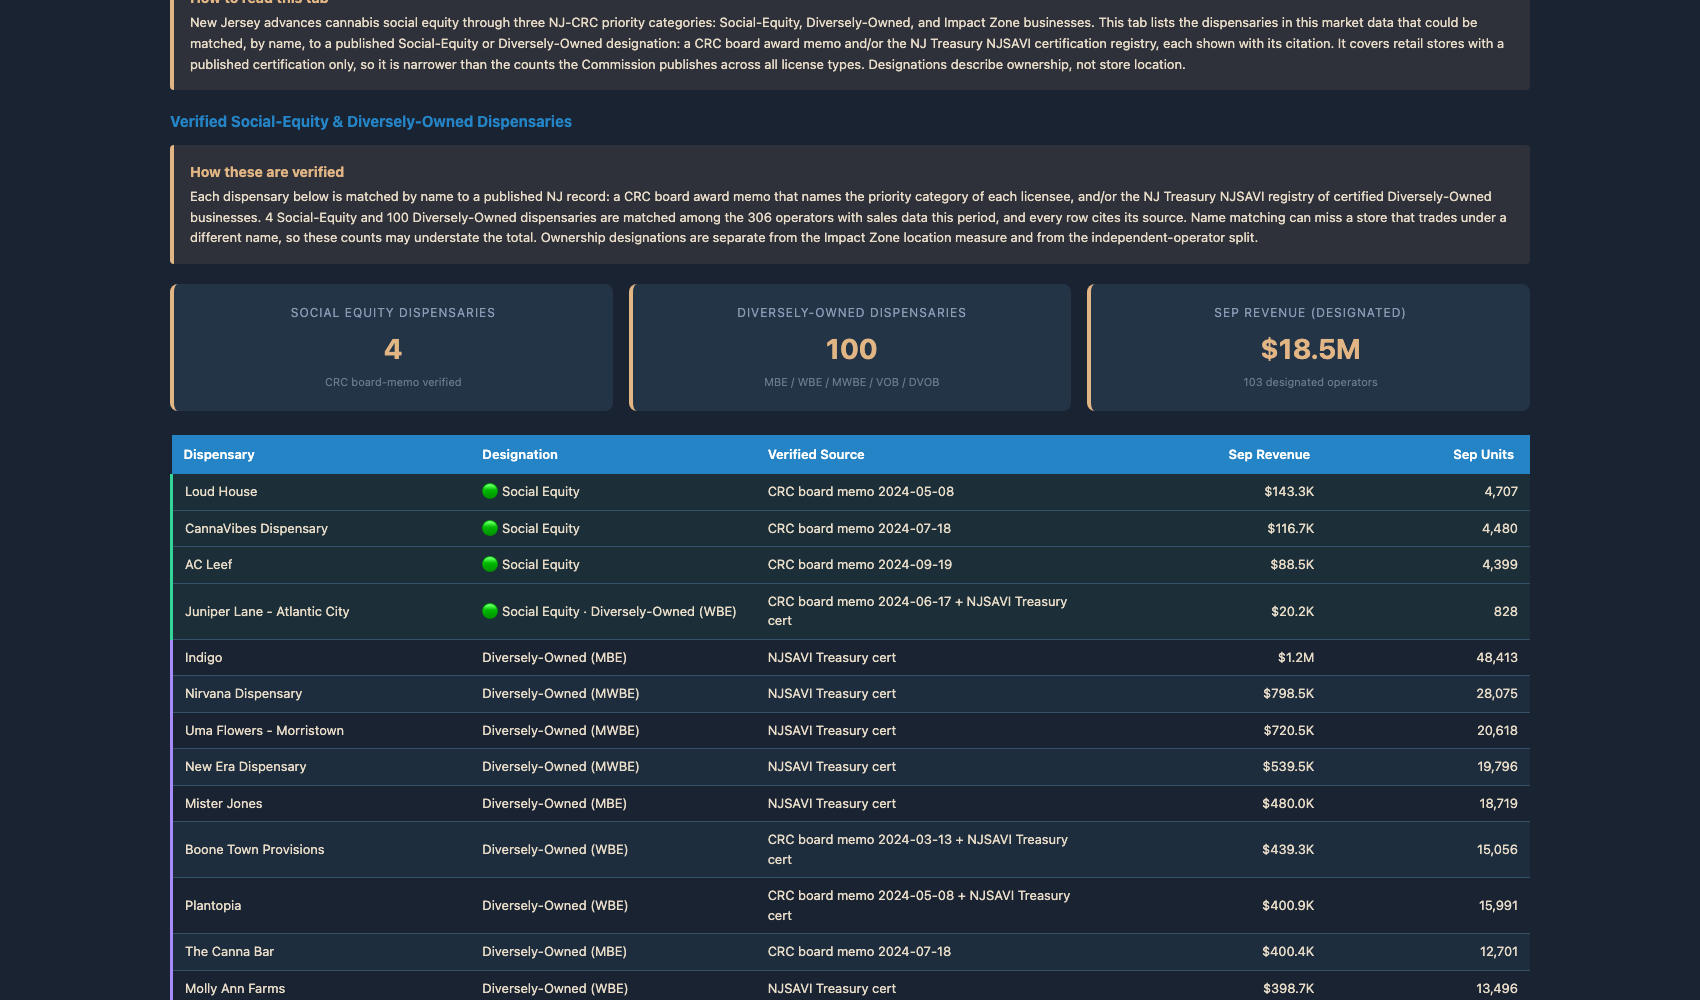
Verified Social-Equity & Diversely-Owned Dispensaries — matched by name to CRC board memos and the NJSAVI registry
CRC / Regulator
Each flagged dispensary is matched by name to a published record, a CRC board award memo or the NJSAVI certification registry, and each row cites its source. It covers retail stores with a published certification, so it is narrower than the Office's own counts across all license types. With the Commission's licensee list, it would use the Office's designations directly.
ROI: Revenue-based equity measures beside the Office's quarterly license benchmarks
Brand Owner
The unified table shows where MSOs and independents actually rank head-to-head in each category. Identify which categories are open competitive ground vs. where MSO scale dominates.
ROI: Category entry decisions grounded in real competitive structure
Dispensary Operator
The Impact Zone designation (separate location-based prong) overlays with verified Social-Equity and Diversely-Owned designations — useful for partnership, mentorship, and incentive program eligibility.
ROI: Match supplier strategy to CRC priority categories
🎤 Narrator
The Social Equity tab looks at a question the Office of Diversity and Inclusion already tracks through its license benchmarks: are equity-designated operators sharing in the market's revenue, not just its licenses? The top half is a single ranked table of multi-state operators and independents, filterable by category, showing where each stands head to head. The lower section lists dispensaries with a verified social equity or diversely owned designation. Each one is matched by name to a published record, a CRC board award memo or the NJSAVI certification registry, and each row cites its source. Impact Zone status, the separate location-based measure, is shown alongside. One thing to know: this covers retail stores with a published certification, so it is narrower than the Office's own counts across every license type. With the Commission's licensee list, the tab would use the Office's designations directly, and the two would line up. For brand owners and dispensary operators, it shows which equity-designated businesses are in the market, for partnership and mentorship.
Tab 7 · Social Equity (continued)
Questions the data raises for policy
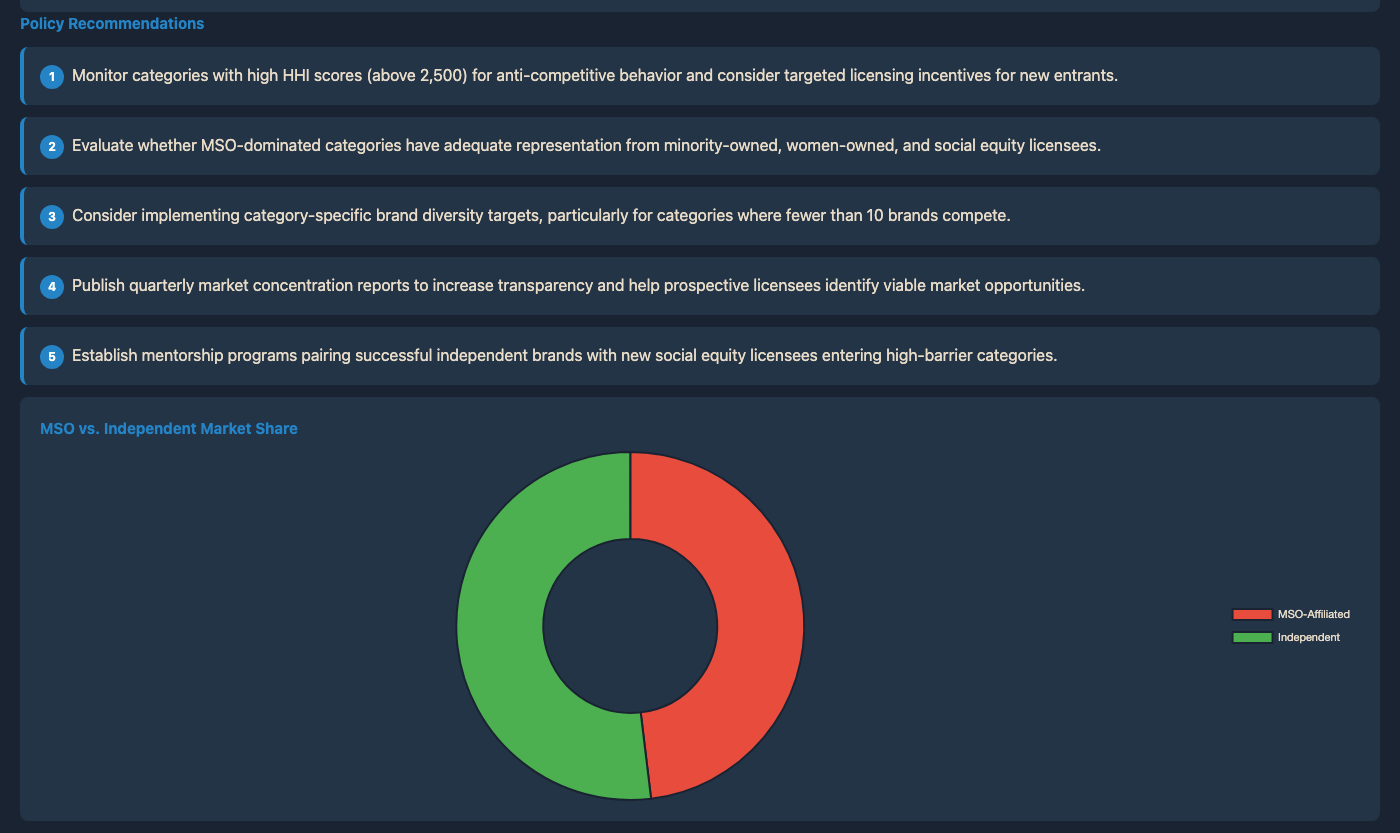
Policy recommendations and MSO vs Independent market share visualization
Prompts the tab generates from the data
Monitor categories with high HHI scores for anti-competitive behavior
Evaluate MSO-dominated categories for diversity representation
Consider category-specific brand diversity targets for categories under 10 brands
Publish quarterly market concentration reports for transparency
Establish mentorship programs pairing successful brands with new social equity licensees
Why this matters
Each prompt is triggered by a metric on the dashboard, and that metric is one click away. They are starting points for the Office's judgment, not conclusions.
CRC / Regulator
Each prompt links back to the metric that triggered it, so staff can test it against the Commission's own data and priorities before acting on it.
ROI: Faster from a market signal to the question worth asking
Brand Owner
Anticipate regulatory direction. If the CRC is looking at HHI scores in your category, you know a concentration review is coming. Plan accordingly.
ROI: Early regulatory signal = strategic preparation time
Dispensary Operator
The mentorship prompt points to where support for equity licensees may grow. Operators who already work with social equity brands are well placed for it.
ROI: Supplier strategy that fits the market's equity priorities
🎤 Narrator
The bottom of the Social Equity tab lists five prompts that its rules generate from the market structure above. Watch categories with high concentration. Look at diversity where multi-state operators dominate. Consider brand-diversity targets where fewer than ten brands compete. Publish concentration reports on a regular schedule. And pair established brands with new social equity licensees as mentors. Each is triggered by a specific metric, and that metric is one click away. They are starting points for the Office's own judgment, not conclusions. For brand owners, they show where regulators are paying attention. For dispensary operators, the mentorship prompt points to where support for equity licensees may grow.
The brand owner's category-fit screen
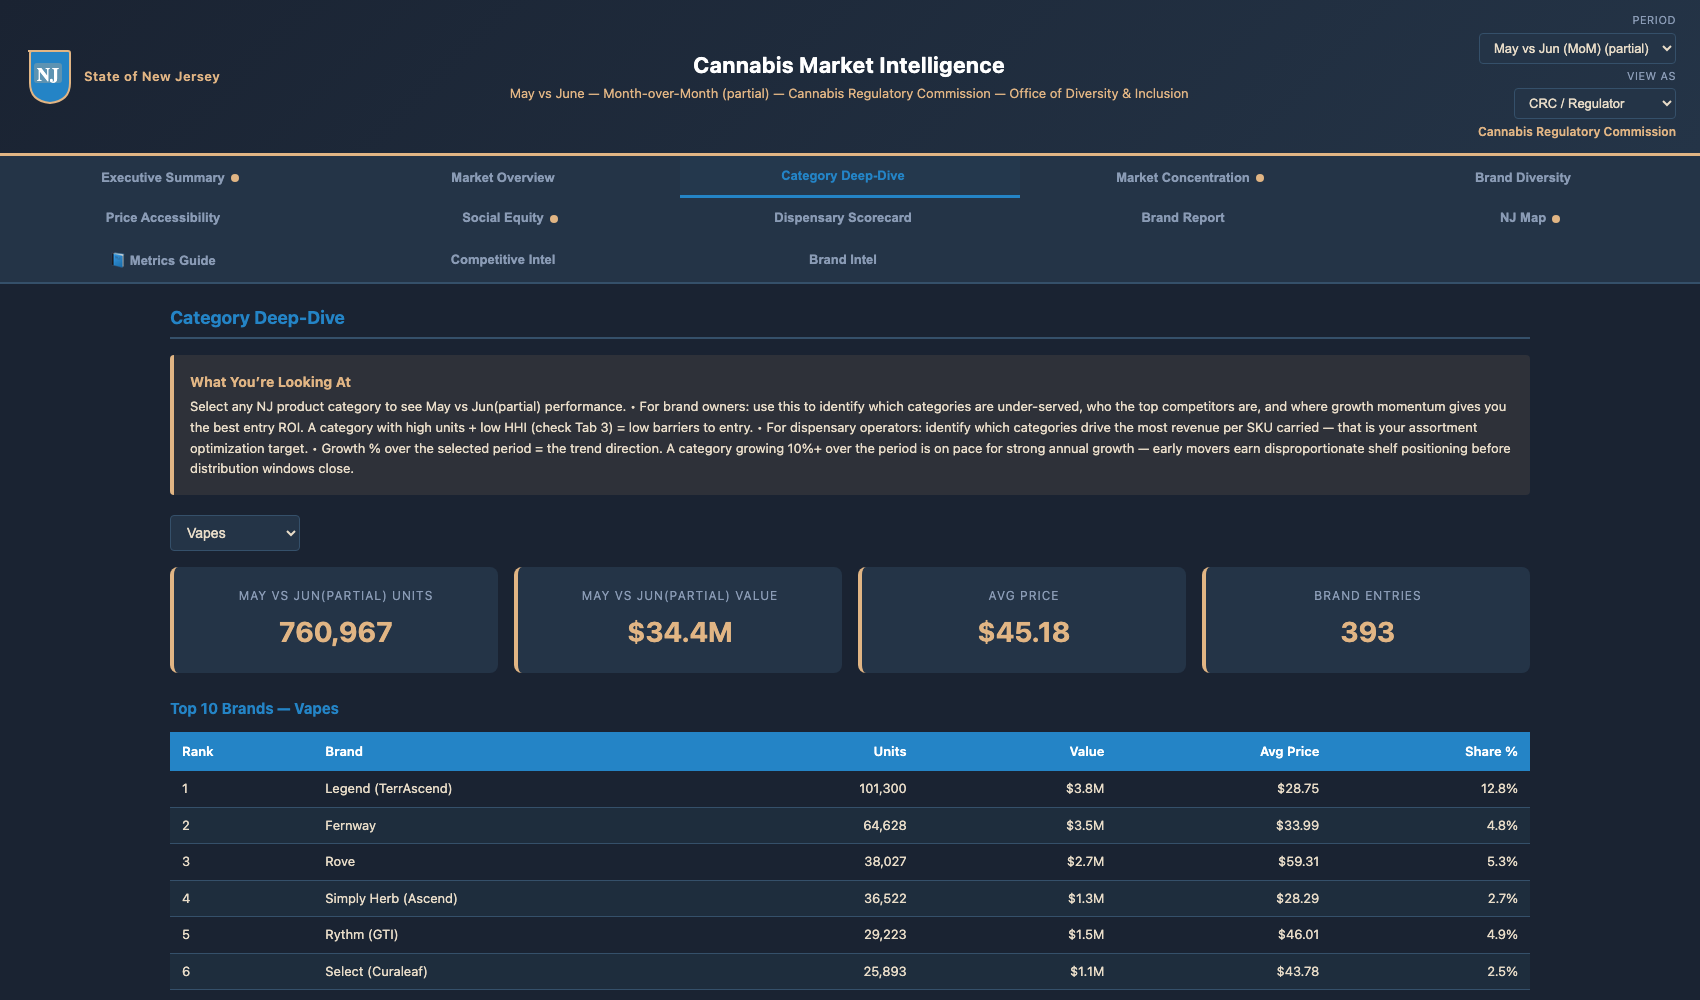
Select a category (defaults to highest-revenue). You see brand count, total units, period revenue, average price, and growth rate. The Top 10 Brands by Units chart tells you who's already winning shelf space. The Growth Metrics panel tells you whether the category itself is expanding or contracting — the foundation question before any entry decision.
CRC / Regulator
Category-level monitoring — whether new product types are gaining shelf space, whether existing categories are concentrating, and where licensing attention may shape the next round of equity.
ROI: Category health signals for licensing policy
Brand Owner
The category trajectory is your investment thesis. A growing category with low concentration = enter now. A shrinking category with dominant incumbents = exit or reposition. Avg price tells you whether you have margin room.
ROI: Category entry/expansion decisions in minutes, not weeks
Dispensary Operator
Per-category Top 10 Brands shows which brands drive the category. Stock the leaders. Watch the growth rate — expanding categories deserve more shelf depth at your location.
ROI: Category-by-category shelf depth informed by market trajectory
🎤 Narrator
Category Deep-Dive is the brand owner's category-fit screen. Select any of the nine product categories from the dropdown. You see brand count, total units, period revenue, average price, and growth rate. Top 10 Brands by Units shows who's already winning shelf space — that's your competitive set. Growth Metrics tells you whether the category itself is expanding or contracting. For brand owners, this is the foundation question before any entry decision — if the category is shrinking, no amount of brand equity saves you. If it's growing with low concentration, that's an entry window. For dispensary operators, the Top 10 chart is a shelf-priority list: stock the leaders, watch the growth, allocate depth where momentum is. For the CRC, category-level shifts are early signals for where licensing attention will shape the next round of equity.
Tab 6 · Price Accessibility
Per-unit price by category — where pricing strategy meets consumer access
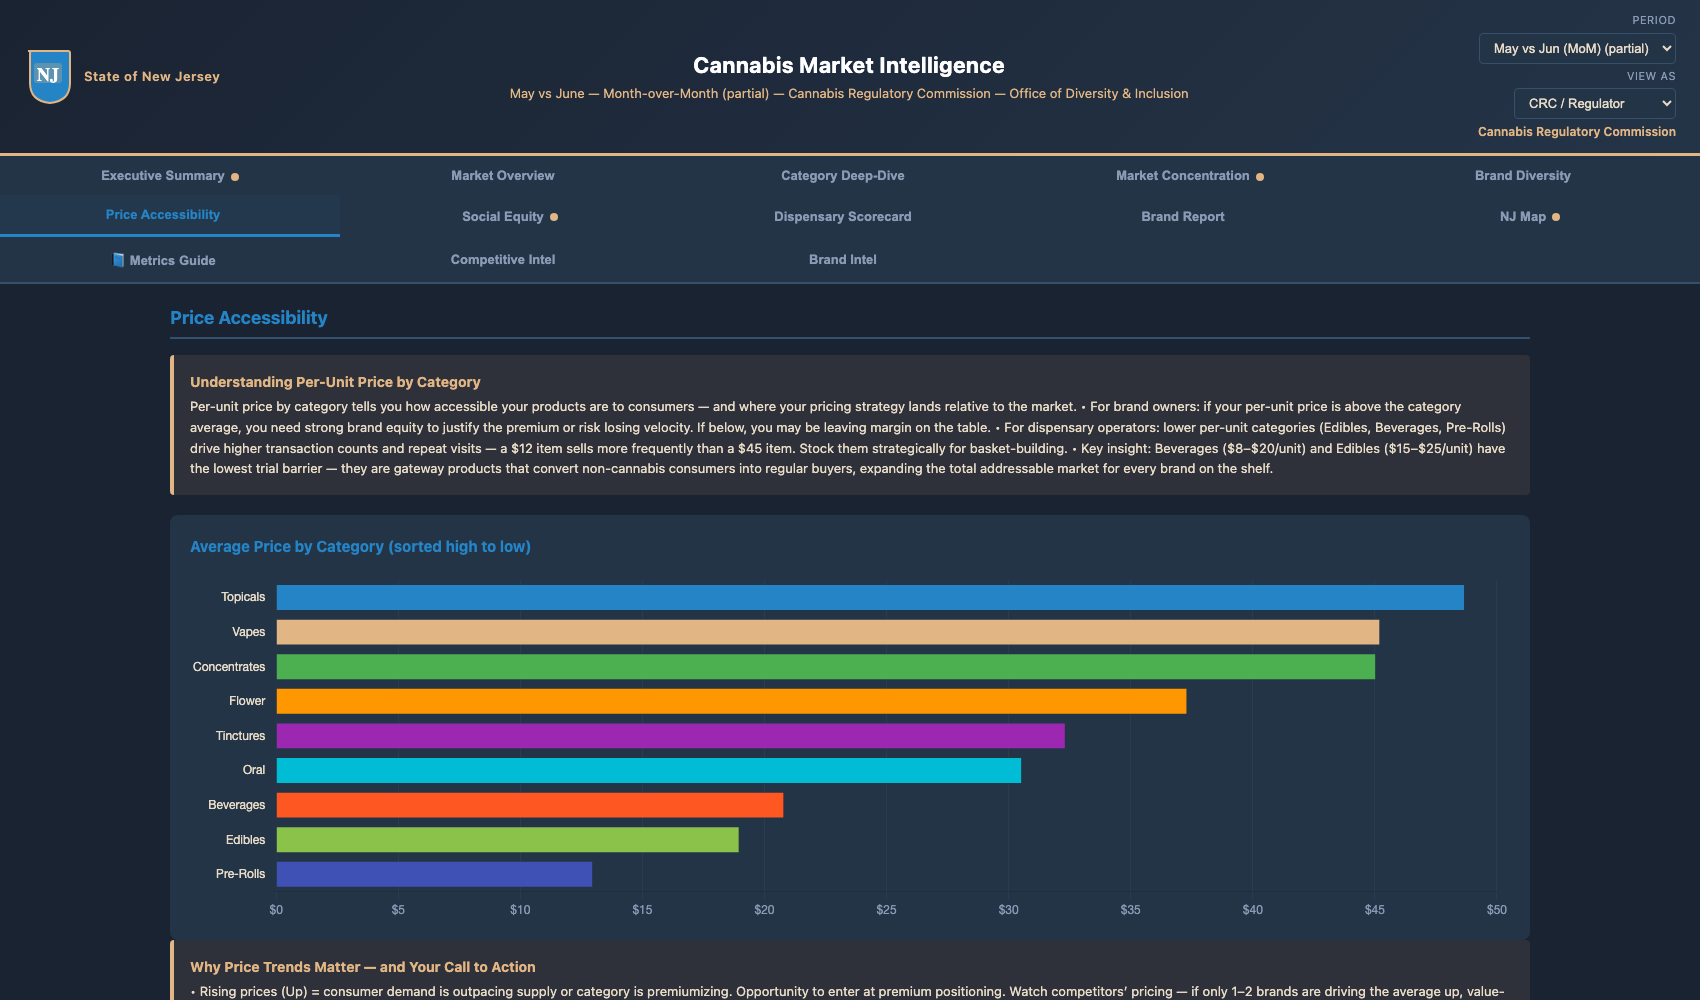
Price Accessibility — Average Price by Category (sorted high to low) + Consumer Access Metrics
Why per-unit price matters
Per-unit price by category tells you how accessible your products are to consumers and where your pricing strategy lands relative to the market. Beverages ($8–$20/unit) and Edibles ($15–$25/unit) are gateway products — they convert non-cannabis consumers into regular buyers and expand the addressable market for every brand on the shelf.
CRC / Regulator
Period-over-period price trends by category. Are prices rising faster than wage growth? Are essential consumer categories pricing out lower-income shoppers? Direct consumer-affordability evidence for policy.
ROI: Consumer affordability monitoring with longitudinal data
Brand Owner
If your per-unit price is above the category average, you need brand equity to justify it — or you're losing velocity. If you're below average, you may be leaving margin on the table. Pricing is competitive intelligence.
ROI: Defensible pricing strategy with margin protection
Dispensary Operator
Lower per-unit categories (Edibles, Beverages, Pre-Rolls) drive higher transaction counts and repeat visits. Stock them strategically for basket-building — a $12 item sells more frequently than a $45 item.
ROI: Basket-building strategy from category price tiers
🎤 Narrator
Price Accessibility tells you per-unit price by category — how accessible your products are to consumers, and where your pricing strategy lands relative to the market. The Average Price by Category chart is sorted high to low. Topicals and Vapes lead at the premium end. Edibles, Beverages, and Pre-Rolls anchor the accessible end. The key insight for the entire ecosystem: Beverages at eight to twenty dollars per unit and Edibles at fifteen to twenty-five dollars per unit have the lowest trial barrier — they're gateway products that convert non-cannabis consumers into regular buyers, expanding the total addressable market for every brand on the shelf. For brand owners, this is competitive pricing intelligence — above the category average, you need brand equity to justify it. Below, you're leaving margin. For dispensary operators, lower per-unit categories drive transaction count and repeat visits. Stock them strategically for basket-building. A twelve dollar item moves more frequently than a forty-five dollar item.
Tab 8 · Brand Competitive Report
Per-brand intelligence — PPI, velocity, and shelf position
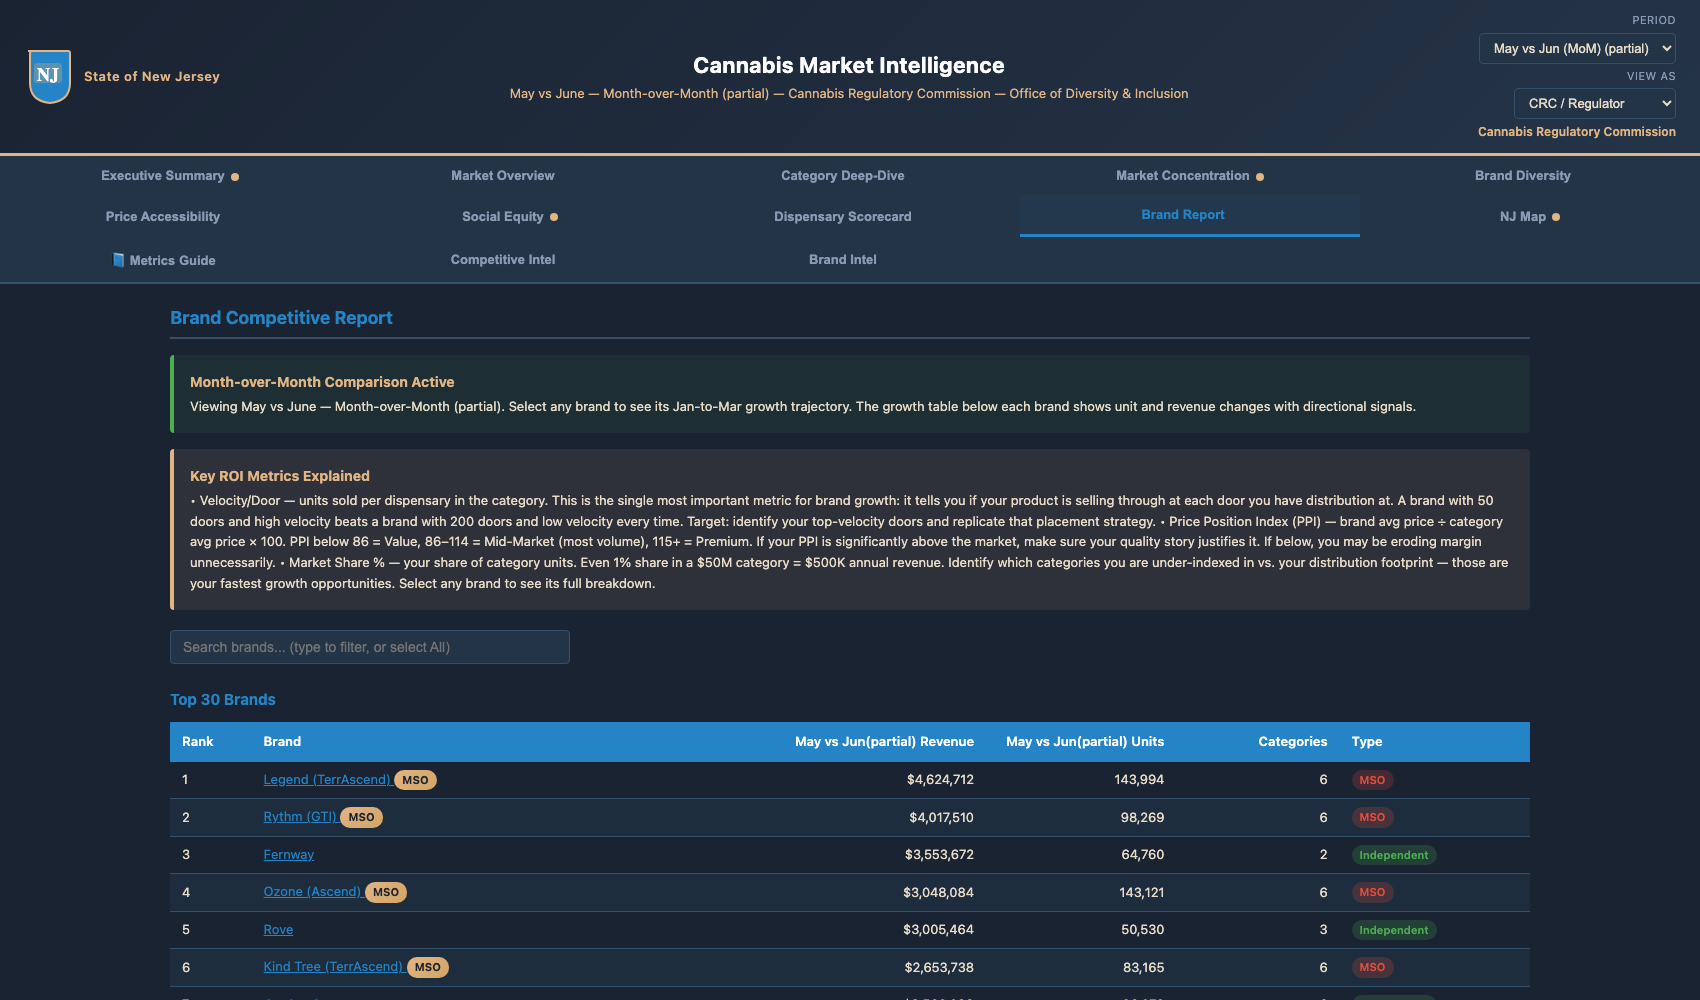
Brand Competitive Report — Top 30 brands ranked by period revenue, with MSO/Independent type tags
Three ROI metrics every brand owner runs dailyVelocity per Door = units sold per dispensary in the category — the single most important metric for brand growth. A brand with 50 doors and high velocity beats 200 doors and low velocity every time. Price Position Index (PPI) = brand price ÷ category avg × 100. Below 86 = Value. 86–114 = Mid-Market. 115+ = Premium. Market Share % = even 1% in a $50M category equals $500K annual revenue.
CRC / Regulator
Top 30 rankings reveal whether independent brands are competing on level ground with MSOs. Track the MSO/Independent ratio in the top 10, top 30, and overall. That's market-fairness data.
ROI: Concentration audit and equity dashboard input
Brand Owner
Find your brand in the ranked list. Compare your velocity per door against the leaders. If your PPI is way above market, your quality story needs to justify it. Identify under-indexed categories — those are your fastest growth opportunities.
ROI: Three concrete brand-growth levers from one screen
Dispensary Operator
Brand-side velocity data informs your purchasing. High-velocity brands sell faster — allocate them more facing-space. Low-velocity brands at high price may signal slow movers you can trim.
ROI: Inventory turn improvement by stocking proven velocity
🎤 Narrator
The Brand Competitive Report is the brand owner's home tab. Top 30 brands ranked by revenue for the period, with MSO and Independent type tags, category count, and clickable drill-down to per-brand detail. Three ROI metrics anchor everything here. Velocity per Door — units sold per dispensary in the category. This is the single most important metric for brand growth, because it tells you whether your product is selling through at the doors you have. A brand with fifty doors and high velocity beats a brand with two hundred doors and low velocity every single time. Price Position Index, or PPI — brand average price divided by category average, times one hundred. Below eighty-six is Value pricing. Eighty-six to one-fourteen is Mid-Market — that's where most volume sits. One-fifteen and above is Premium — make sure your quality story justifies it. Market Share percent — even one percent of a fifty million dollar category equals five hundred thousand dollars in annual revenue. Find the categories you're under-indexed in versus your distribution footprint. Those are your fastest growth opportunities. Click any brand for its full breakdown.
Tab 8 · Dispensary Scorecard
Per-location performance, ranked and actionable
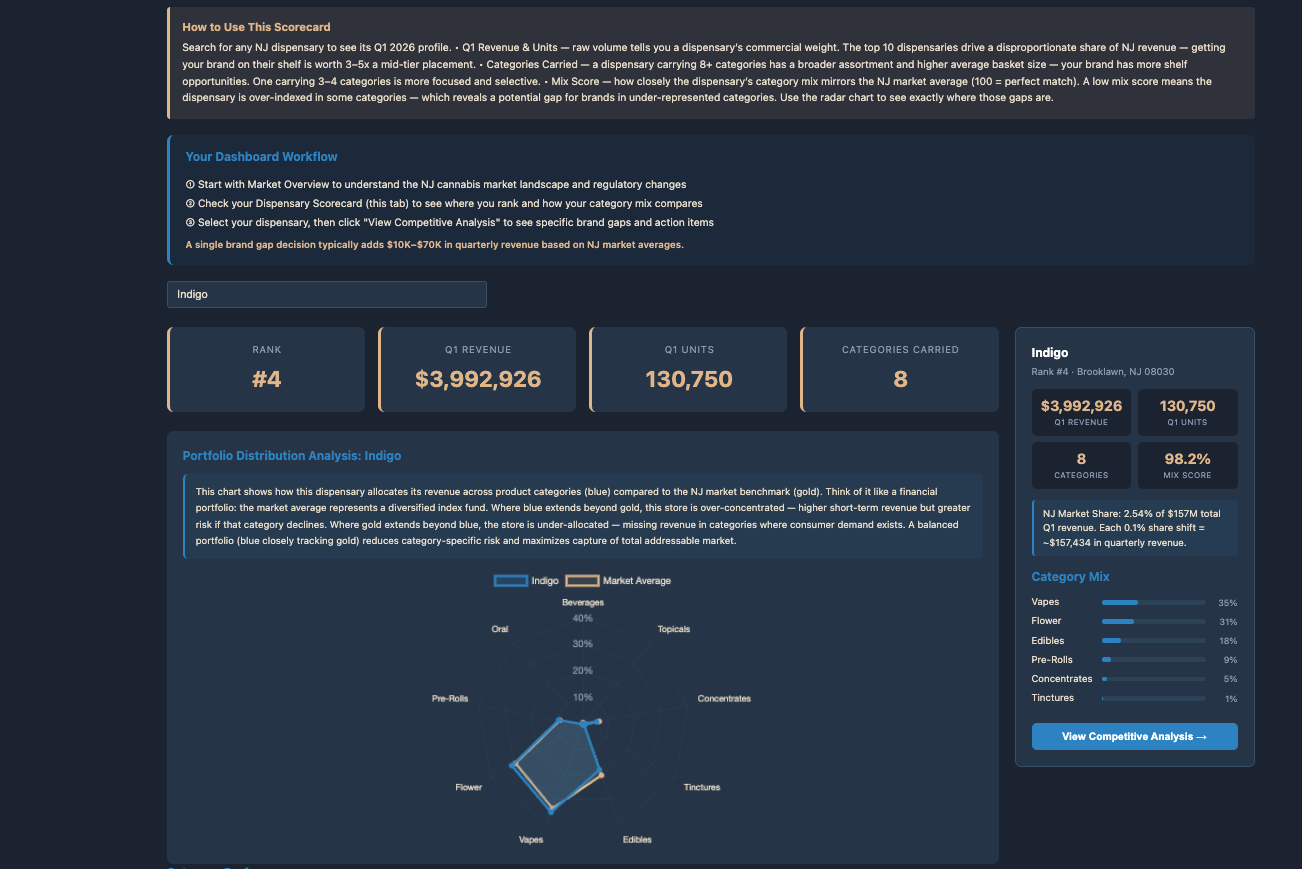
Scorecard navigation with cross-tab link to Competitive Intel
What you see per dispensary
Statewide rank, period revenue, period units, a category radar showing allocation vs market average, and a Mix Score (0–100) measuring portfolio balance. (Example values shown for illustration — the live dashboard renders period-current numbers.)
CRC / Regulator
Compare dispensary performance across the state. Identify outlier locations that may warrant closer review. Spot regional concentration patterns.
ROI: Supervisory oversight powered by live data, not annual reports
Brand Owner
Identify top-performing dispensaries to target for distribution. A #4 ranked location at $3.99M Q1 is a door worth getting into.
ROI: Sales targeting precision from market-wide dispensary rankings
Dispensary Operator
Your location, benchmarked against 280 others. See exactly where your category mix deviates from market average and by how much.
ROI: Every 1% mix correction toward market avg = incremental revenue from existing traffic
🎤 Narrator
The Dispensary Scorecard gives every location in New Jersey its own performance dashboard. Select a dispensary and you see its statewide rank, period revenue, units sold, a category radar chart showing how its product mix compares to the market average, and a Mix Score from 0 to 100 measuring portfolio balance. The workflow guide at the top walks first-time users through the three-step process: select, analyze, act. For dispensary operators, this is your competitive position, quantified. For brand owners, it's a ranked list of every active door in the state with its category mix. For the CRC, it's a supervisory lens on the entire market.
Tab 8 · Dispensary Scorecard (continued)
Category performance with automated recommendations
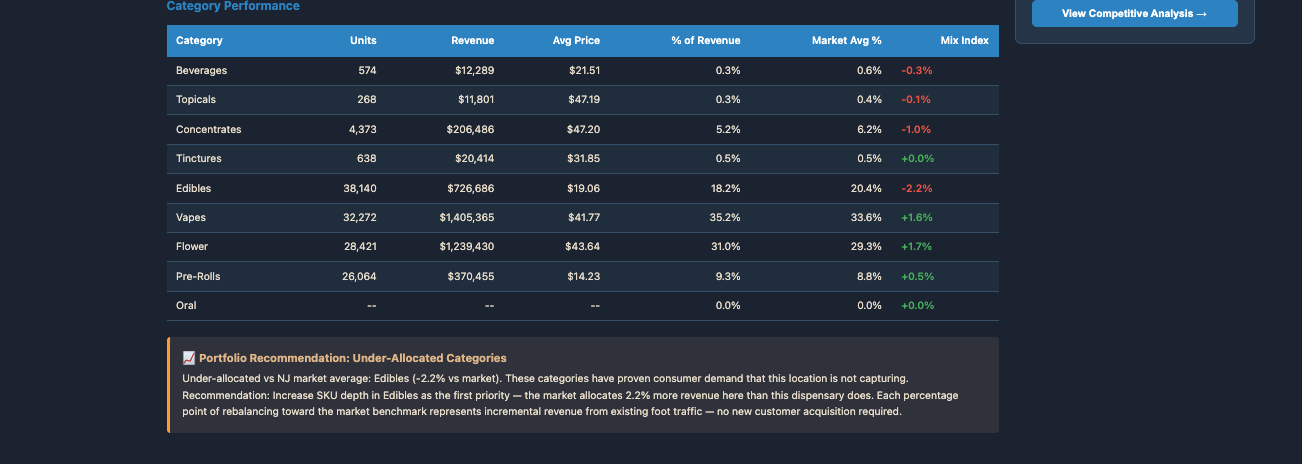
Category performance table with Market Avg comparison and automated portfolio recommendation
Automated portfolio recommendation
The dashboard detects under-allocated categories and generates specific guidance. Example: "Under-allocated vs NJ market average: Edibles (-2.2% vs market). Increase SKU depth in Edibles as the first priority." Each recommendation is backed by the delta between the dispensary's mix and the statewide benchmark.
CRC / Regulator
Aggregate under-allocation patterns reveal whether certain product categories face systemic distribution gaps across the state, not just at individual locations.
ROI: Systemic access gap identification for consumer protection mandates
Brand Owner
Dispensaries with under-allocated categories in your product line are warm leads. They need what you sell and the data proves it.
ROI: Data-qualified sales leads, zero cold calling
Dispensary Operator
Direct action item: the dashboard tells you which category to expand, by how much, and why. No analyst needed.
ROI: Incremental revenue from rebalancing with no new customer acquisition
🎤 Narrator
Scrolling down in the Scorecard, you see the category performance table with each category's units, revenue, average price, percent of revenue, market average, and a Mix Index showing where the dispensary is over or under the market. The automated Portfolio Recommendation at the bottom is the action item. It identifies under-allocated categories and tells you exactly what to do. In this example, Edibles is 2.2 percentage points below market average, and the recommendation is to increase skew depth in Edibles as the first priority. For dispensary operators, that's a direct revenue action with no new customer acquisition required. For brand owners, those under-allocated dispensaries are your warmest sales leads.
Tab 10 · NJ Map
Geographic dispensary distribution — access at the county scale
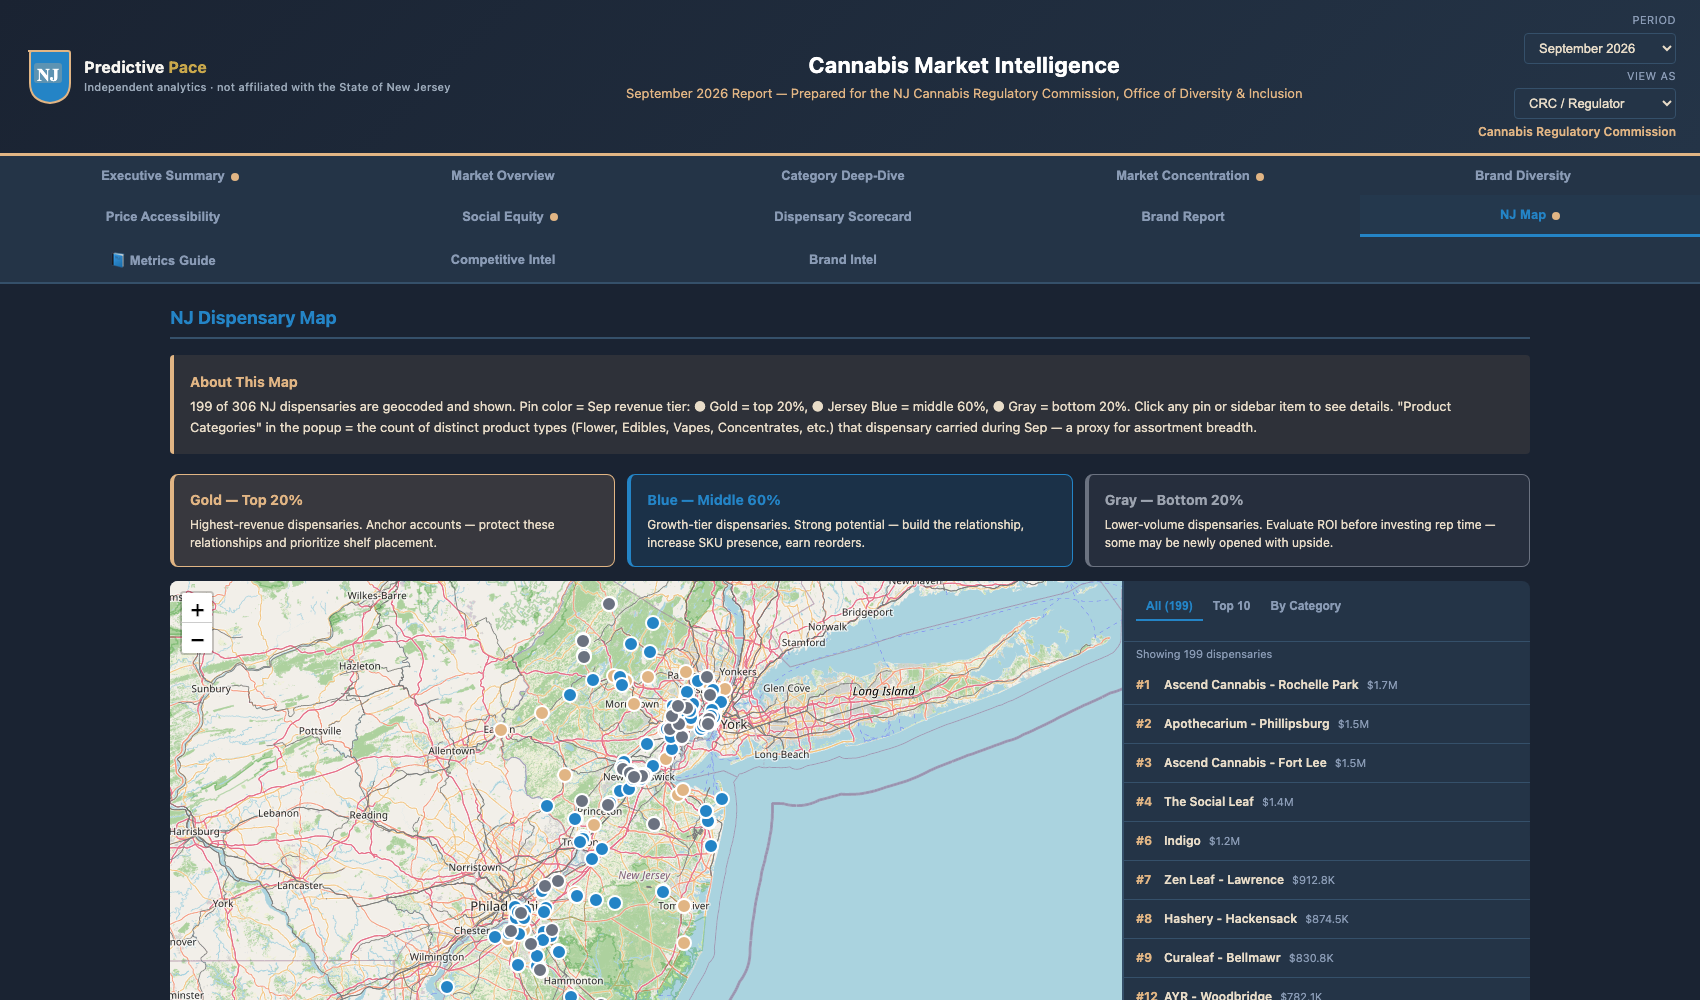
NJ Dispensary Map — every active location color-coded by revenue tier (Gold = Top 20%, Blue = Middle 60%, Gray = Bottom 20%)
Map filters & categories
Filter by All, Top 10, or by category (Beverages, Flower, Pre-Rolls, etc.) Click any pin to center the map. Pin colors are real revenue tiers, not arbitrary marketing — gold pins are top-20% revenue, blue is middle-60%, gray is bottom-20%. The right sidebar lists all dispensaries by rank with click-to-jump navigation.
CRC / Regulator
Geographic distribution analysis — are dispensaries spread equitably across NJ, or concentrated in specific counties? Top-tier vs bottom-tier revenue maps to local economic dynamics — useful for licensing geographic balance reviews.
ROI: Geographic equity audit ready for committee testimony
Brand Owner
Visualize your existing doors against the full market. Identify geographic clusters where your distribution is thin and the top-tier dispensaries you're missing.
ROI: Geographic gap visualization for distribution planning
Dispensary Operator
See your location in context. Are you in a saturated cluster or a relative whitespace? Are top-tier competitors nearby? Pin color tells you the revenue tier of every neighbor at a glance.
ROI: Trade area analysis with competitor revenue tier visible
🎤 Narrator
The NJ Map is the geographic view of the entire market. Two hundred ninety-three dispensaries, each plotted on an interactive Leaflet map, color-coded by revenue tier. Gold pins are top twenty percent by revenue. Blue is the middle sixty. Gray is the bottom twenty. Filter by All, Top 10, or by product category to see which dispensaries dominate each segment. The right sidebar lists every dispensary by rank with click-to-jump navigation. For the CRC, this is your geographic equity audit. Are dispensaries spread equitably across all twenty-one New Jersey counties, or are they concentrated in a handful of high-income clusters? The revenue tier coloring maps directly to economic distribution — gold pin clusters tend to track wealth and population density. For dispensary operators, this is your trade-area analysis. Your dot is in context. You can see whether you're in a saturated cluster or a relative whitespace, and you can see at a glance which of your neighbors are top-tier competitors.
How it works
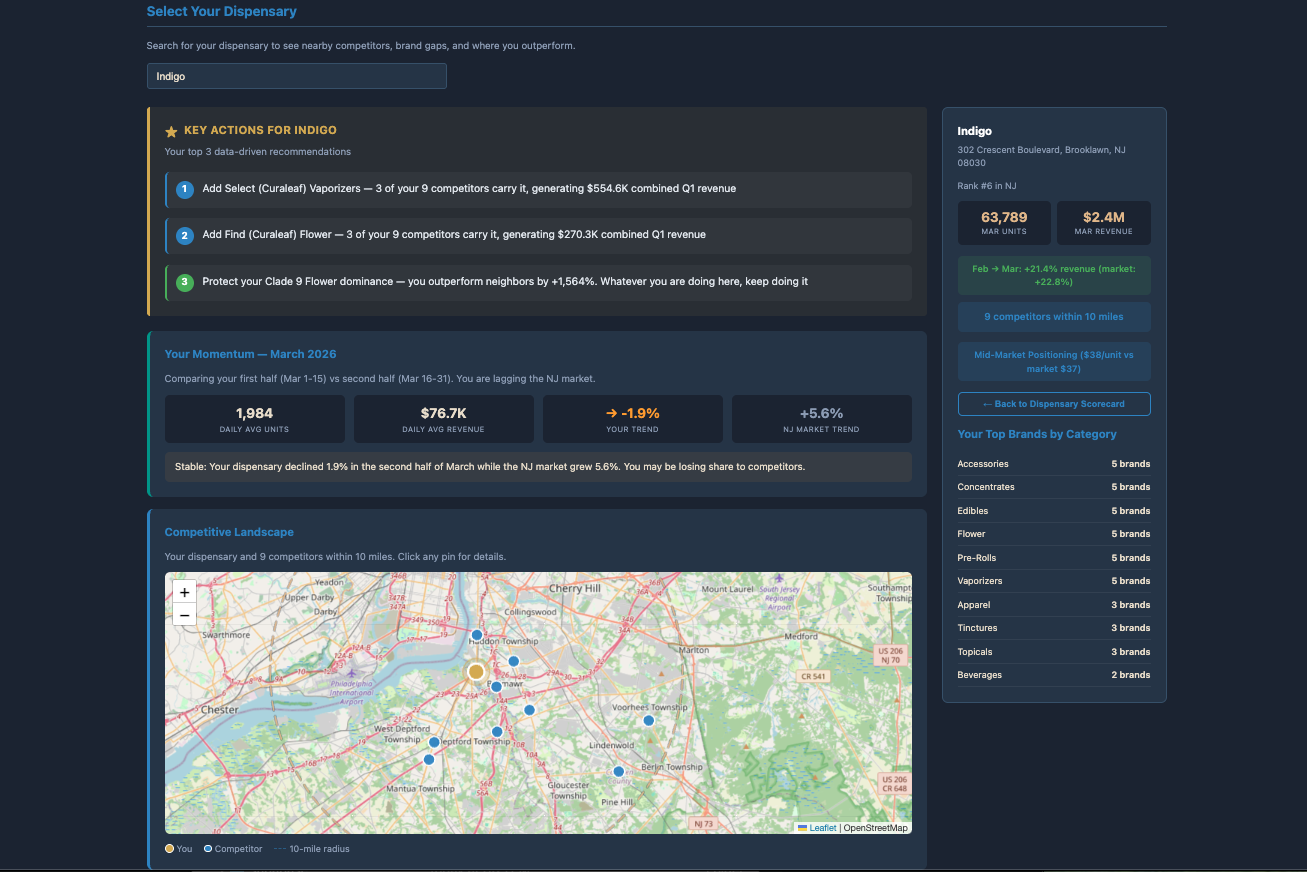
Select a dispensary. The platform analyzes every brand carried by every competitor within a 10-mile radius. It then generates three types of insights: what competitors carry that you don't (brand gaps), where you're underperforming vs neighbors (investigate), and where you outperform (protect).
CRC / Regulator
Competitive density maps reveal geographic access patterns. Are certain regions over-served while others lack product diversity?
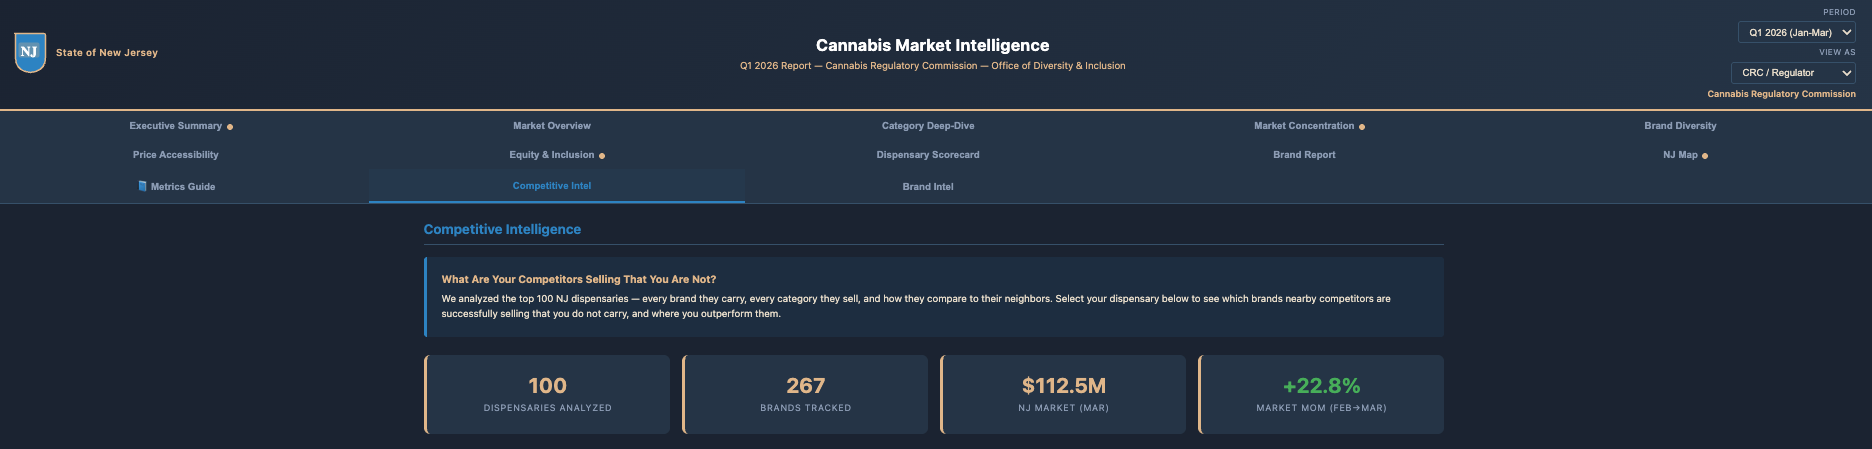
Competitive Intelligence is the most actionable tab on the platform. Select any dispensary from the dropdown and it analyzes every brand, every category, at every competitor within a 10-mile radius. The map shows your location in gold and competitors as blue pins with a dashed 10-mile ring. The Key Actions callout at the top gives three scored recommendations: add a brand, investigate an underperformance, or protect an advantage. 100 dispensaries fully analyzed, 267 brands tracked, $112.5 million in New Jersey market Q1 March revenue. For dispensary operators, this is your competitive playbook, updated with every data refresh.
Tab 11 · Competitive Intel (continued)
Brand gaps, pricing, rising brands, and whitespace
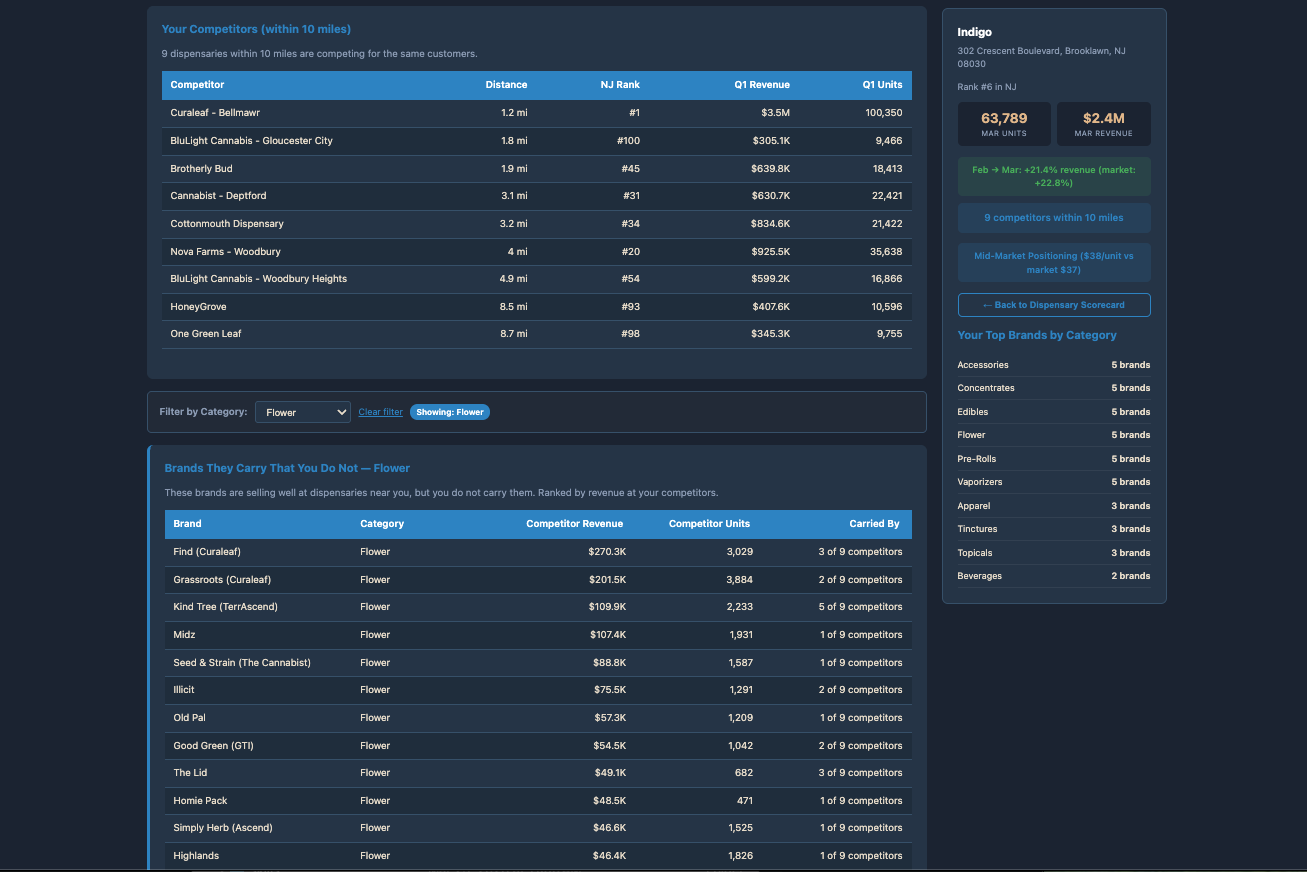
Competitor table + Brand Gaps (blue) filtered by Flower
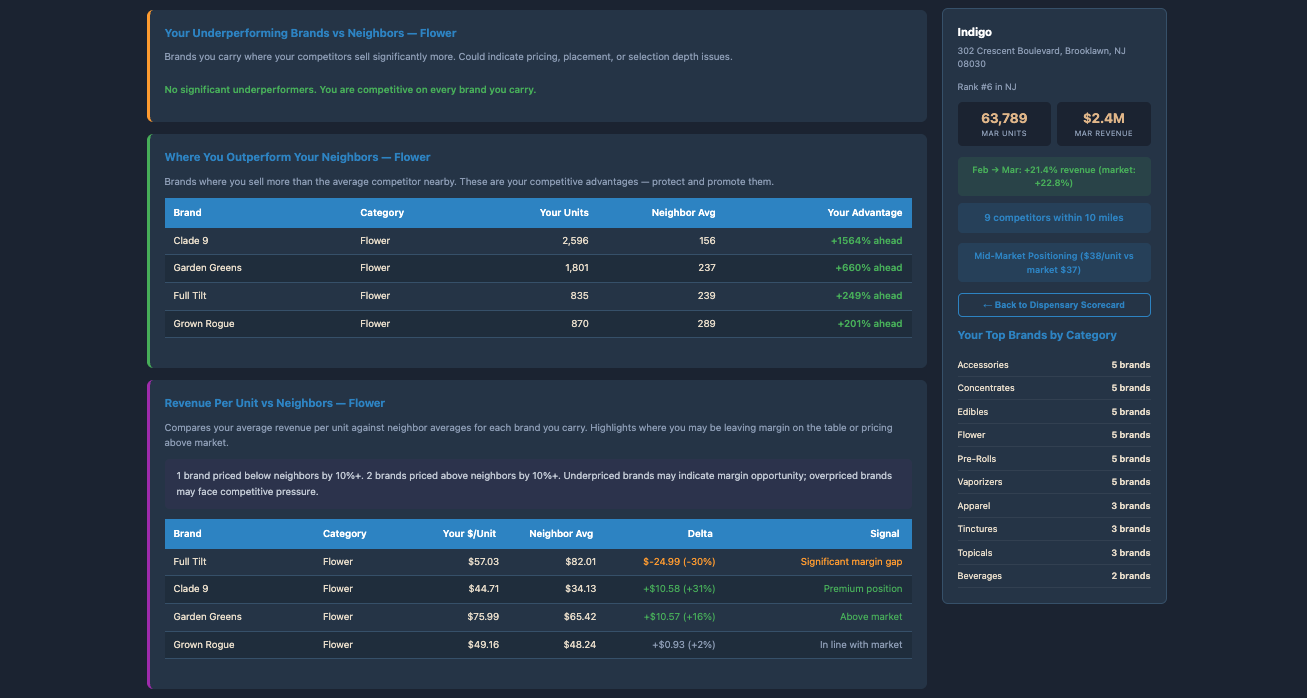
Outperformers (green), Revenue Per Unit (purple) with pricing signals
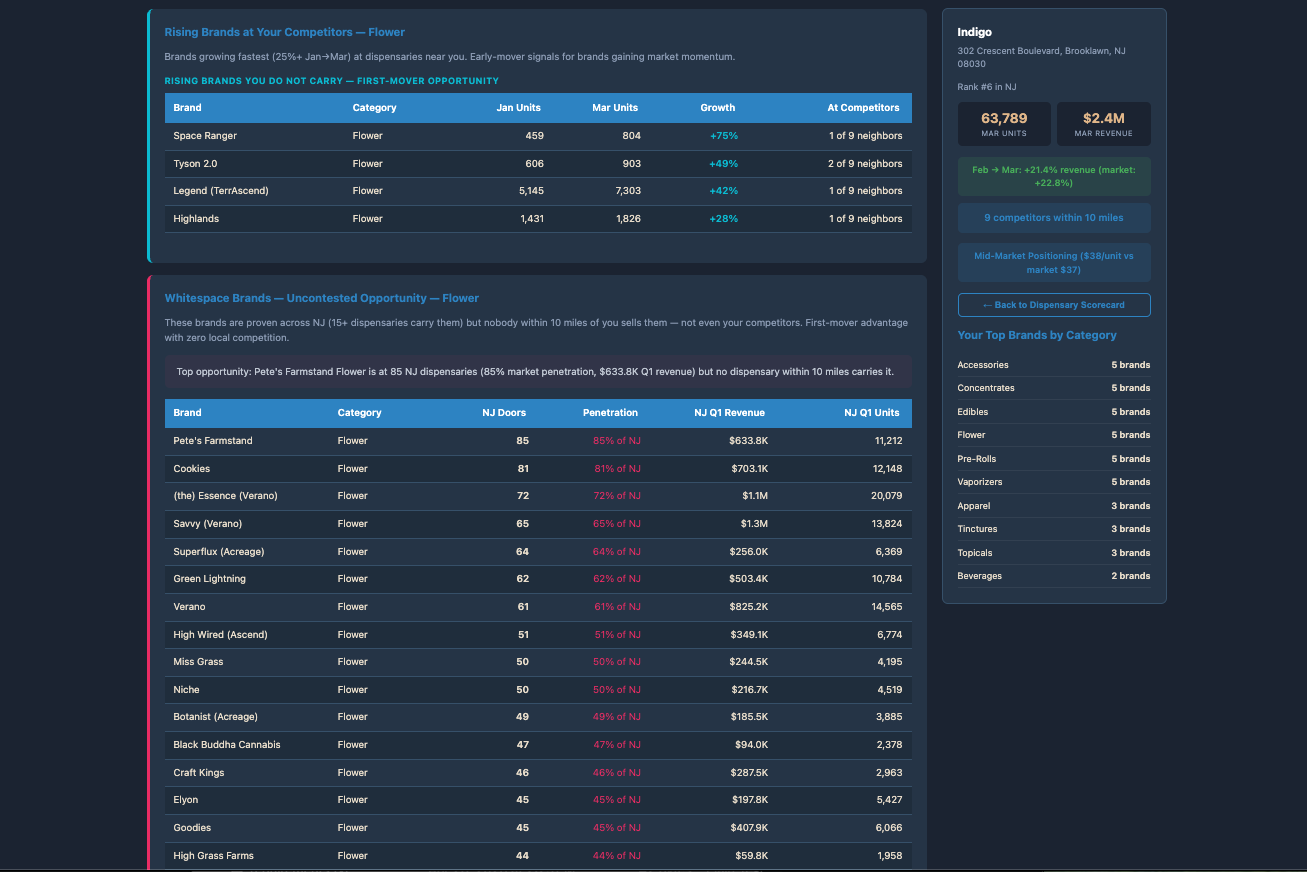
Rising Brands (cyan), Whitespace Brands (pink) with penetration %
What each Competitive Intel section reveals
Brand Gaps (blue) — Brands your competitors carry that you don't. Ranked by competitor revenue. These are proven sellers in your trade area.
Outperformers (green) — Brands where you outsell neighbors by 30%+. These are your competitive moat. Protect them with prominent placement and promotions.
Revenue Per Unit (purple) — Your $/unit vs neighbor average, with margin signals: Premium, Above Market, In Line, Significant Margin Gap.
Rising Brands (cyan) — 25%+ Jan→Mar growth at competitors. Split into brands you don't carry (first-mover opportunity) and brands you do (validation).
Whitespace Brands (pink) — 15%+ statewide penetration but absent from your entire 10-mile radius. Zero local competition. First-mover advantage with proven demand.
CRC / Regulator
Whitespace analysis reveals product access deserts where consumers lack category options within their area. Rising brands show emerging market participants gaining traction.
ROI: Consumer access monitoring at geographic granularity
Brand Owner
Rising Brands is your competitive threat radar. Whitespace is your zero-competition expansion map. Revenue Per Unit tells you where pricing power exists vs where you're in a margin squeeze.
ROI: Distribution + pricing strategy from one screen
Dispensary Operator
Whitespace = carry a brand nobody nearby carries, capture all local demand. Rising Brands = get ahead of the curve before competitors catch up. Brand Gaps = stop losing customers to neighbors.
ROI: Three revenue levers (gaps, whitespace, rising) from one tab
🎤 Narrator
The Competitive Intel tab has six analysis sections, all filterable by category. Brand Gaps in blue show brands your competitors sell that you don't, ranked by revenue. Outperformers in green are your moat, the brands where you outsell neighbors by 30% or more. Revenue Per Unit in purple compares your pricing against the neighbor average with clear signals: premium, above market, in line, or significant margin gap. Rising Brands in cyan shows which brands grew 25% or more from January to March at your competitors. If you don't carry them, that's a first-mover opportunity. If you do, it's validation. And Whitespace Brands in pink is the zero-competition play: brands with 15% or more statewide penetration that nobody within 10 miles carries. That's proven demand with no local competitor. Three revenue levers from one tab.
Tab 13 · Brand Distribution Intelligence
The brand owner's mirror of Competitive Intel
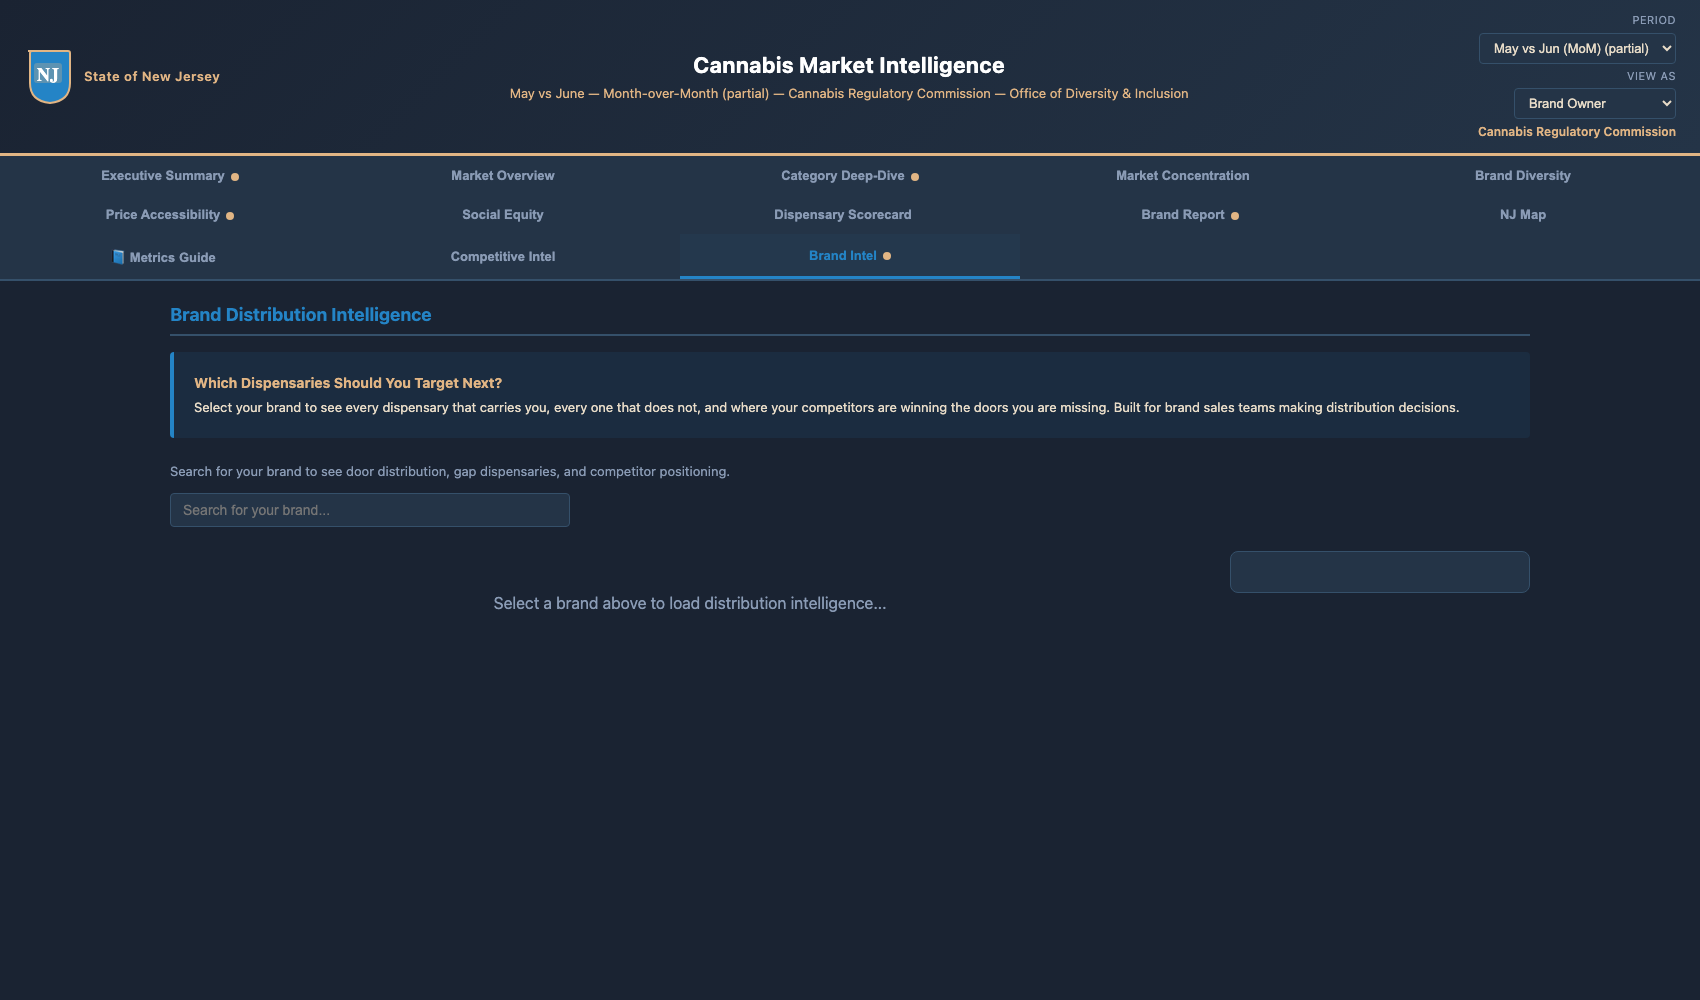
Brand Distribution Intel — door map, gap dispensaries, door performance, competitor brands
Same data, flipped perspective
Competitive Intel asks "what brands are my competitors selling that I don't carry?" Brand Distribution Intel asks the opposite: "which dispensaries near my existing doors don't carry me, and how much revenue are they doing?" One data pipeline, two productized views — one for dispensary operators, one for brand owners.
CRC / Regulator
Brand distribution density maps reveal whether independent brands have meaningful door coverage or are concentrated in a few accounts. A useful equity lens for licensing reviews.
ROI: Geographic + ownership equity insight in one view
Brand Owner
Select your brand. Instantly see every dispensary in the state that doesn't carry you, ranked by revenue. Plus your door performance vs neighbor averages, and which competitor brands are filling the shelf space you don't.
Brands proactively reach out with data-backed pitches built from this tab. Expect partnership conversations that lead with revenue numbers instead of distributor-deck claims.
ROI: Higher-quality supplier conversations, less time on bad-fit pitches
🎤 Narrator
The final tab we'll walk is Brand Distribution Intelligence — the thirteenth tab and the most strategically important addition for brand-owner audiences. It's the brand-owner's mirror of Competitive Intel. Same data infrastructure, flipped perspective. Select your brand. The platform instantly shows you every dispensary in New Jersey that doesn't carry you, ranked by revenue. Your door performance compared to neighbor averages. The competitor brands filling the shelf space where you should be. For a brand owner, this is a ready-made prospecting list backed by real revenue data — not a distributor's pitch deck. For dispensary operators, expect more brand reps to lead conversations with this data, which raises the quality of every supplier meeting. For the CRC, it's a useful equity lens that surfaces whether independent brands have meaningful door coverage or are concentrated in a few accounts. One screen, three audiences, one infrastructure — the platform's whole product thesis on display.
The value case
ROI by persona
CRC / Regulator
Monthly
market and equity view between quarterly reports
Market health every month, beside the Commission's quarterly reports
Equity designations cited to their published records
Policy prompts linked to the metric that triggered them
Geographic access pattern monitoring across every active location
Brand Owner
Per door
distribution and pricing by store and category
Distribution gaps identified per door, per category
Zero-competition whitespace for first-mover expansion
Pricing intelligence vs neighbor averages
Rising competitor detection with growth trajectories
Dispensary Operator
10 miles
competitor view around every store
Automated portfolio rebalancing recommendations
Revenue uplift from mix correction to market benchmarks
Competitor assortment intelligence within 10-mile radius
Brand gap + whitespace = three revenue levers per refresh
Compounding value
The platform refreshes with every data load. Each refresh generates a new set of recommendations, gaps, and signals. The ROI isn't a one-time report — it compounds monthly as market dynamics shift and new opportunities surface automatically.
🎤 Narrator
Here is what each role gets. For the Commission, a monthly view of market health and equity that sits between its own quarterly reports, with every equity designation cited to its published record. For brand owners, distribution gaps, pricing and rising competitors, store by store. For dispensary operators, a view of every competitor within ten miles, with brand gaps and whitespace to act on. And this compounds. Every data refresh generates new recommendations, new gaps, new signals. Each month's data adds to the picture.
The team behind the platform
Predictive Pace — intelligence platforms for regulated markets
Predictive Pace builds business intelligence platforms for brand-side companies in regulated and emerging categories. We specialize in turning fragmented market data into decision-ready dashboards — the kind that get opened Monday morning, not bookmarked and forgotten.
What we do
POS data ingestion, normalization, and validation pipelines
Interactive dashboards with auto-generated recommendations
Competitive intelligence and market structure analysis
Multi-tenant deployment — one platform, many brands
One page on the team behind the platform. Predictive Pace builds business intelligence platforms for regulated and emerging markets. Five platforms in production today. New Jersey Cannabis Market Intelligence, which you've been walking through. BrandLens Pro, per-brand dashboards live for four New Jersey cannabis brands. PG Analytics for hemp beverage performance. PG Intel for 50-state hemp regulatory tracking. And Trellis for cannabis compliance. The pattern is the same across all of them: take fragmented market data, normalize it, validate it, and turn it into dashboards with auto-generated recommendations. No app install, no login friction, monthly refreshes with automated validation. More at predictivepace.com.
What's next
Your next step, based on your role
CRC / Regulator
Next steps
Explore the live dashboard — bookmark your role's filtered view
Share with your team — send this deck in "Read All" mode
Request a custom view — specific categories, date ranges, or equity metrics
Schedule a briefing — 30-min live walkthrough for your office
Brand Owner
Next steps
Find your brand in the Brand Report tab
Run Competitive Intel on your top 3 dispensary doors
Request a BrandLens Pro dashboard — your brand's own 9-tab analytics
Connect — we can pull your brand-specific data within 48 hours
Dispensary Operator
Next steps
Find your location in the Dispensary Scorecard
Review your portfolio recommendation — the dashboard generates it automatically
Check Competitive Intel for brand gaps in your 10-mile radius
Act on whitespace — brands with proven demand and zero local competition
Reach out to get started
Each persona gets a tailored onboarding. Schedule a 30-minute briefing, request a custom view, or get your own brand-specific dashboard. We'll have you in real data within 48 hours.
🎤 Narrator
Here's what to do next, based on your role. If you're with the Commission, reach out to schedule a 30-minute briefing for your office. We can build a view around your own priorities, including the equity and small-business categories the Office of Diversity and Inclusion already tracks, measured as revenue as well as licenses. If you're a brand owner, ask us about a dedicated dashboard built around your brand — we can have your brand-specific data live within 48 hours, with your own competitive intel, brand gap analysis, and distribution map. If you're a dispensary operator, request a scorecard customized to your location, with a deeper portfolio recommendation and a competitive intel view tuned to your trade area. Each persona gets a tailored onboarding. Three paths, one conversation away.
Close
Three reasons this platform exists
Equity
measured, not assumed
MSO vs Independent, entry barriers, policy prompts — all from live market data
Access
for every market participant
Every active dispensary, every tracked brand, one dashboard — same intelligence for everyone
Action
not just visibility
Every tab generates recommendations, not just charts. Decisions, not data.
Three reasons this platform exists. Equity measured, not assumed. Access for every market participant. And action, not just visibility. Every tab generates recommendations, not just charts. Reach out at spacely at predictivepace dot com, or visit predictivepace dot com. Thank you for your time.